VexRiscv, OpenOCD, and Traps
- Introduction
- Debug Flow Overview
- A Minimal CPU System
- System Setup with a Generic JTAG Debug Interface
- Building the Design for FPGA
- Debug Logic Resource Cost
- Compiling the Custom OpenOCD Version
- Connecting to the JTAG TAP of the FPGA
- The vexriscv_init.cfg file
- Debugging with Barebones GDB
- Debugging with gdbgui
- VexRiscv Traps
- Forcing the Trap Handler to Halt the CPU
- There’s More to Traps than Just Catching Errors
- Conclusion
- References
Introduction
The VexRiscv is fantastic soft-core RISC-V CPU: small, configurable, yet with decent performance. It’s perfect for FPGAs, and I use it in pretty much all my FPGA projects.
It’s also one of the few open source CPUs for which there’s extensive debugger support. There’s a customized version of OpenOCD which acts as the glue between GDB and the VexRiscv in your projects.
While there’s some documentation available, there isn’t much, and it left me wanting to know more about it.
In this blog post, I’ll first discuss the infrastructure that’s makes embedded debugging possible. I’ll set up a small VexRiscv design with debug support, show how to make it work on real hardware, and I’ll talk how I use CPU exceptions and traps to find issues in my code.
Debug Flow Overview
When you only ever have debugged code that runs on your native PC, or on an embedded system for which an IDE hides all the details, understanding all the components of an embedded debug system can be a bit confusing.
The figure below illustrates the different components of an end-to-end debug system. While Vexriscv specific, the general concepts apply to any embedded debug system.

Bottom up, we encounter the following components:
-
VexRiscv CPU
The CPU that is running the code that we need to debug.
-
VexRiscv Debug Plugin
Hardware plugins are an interesting concept that’s integral to the VexRiscv design philosophy. You can read more about it in this blog post.
DebugPlugin adds the necessary logic to the VexRiscv CPU to halt and start the CPU, to set hardware breakpoints (if there are any), and to insert random instructions into the CPU pipeline.
The plugin also adds a external SystemDebugBus to the CPU to control these debug operations.
-
SystemDebugger
This block is a small layer that converts the lightweight SystemDebugRemoteBus above it into the wider SystemDebuggerBus. These busses are VexRiscv specific. You normally don’t need to worry about them.
-
JtagBridge
The JTAG bridge takes in the standard 4 JTAG IO pins, feeds them into a JTAG test access port (TAP), adds a number of debug scan registers, and has the logic talk to the SystemDebugRemoteBus.
-
USB to JTAG Dongle
The hardware that links the development PC to the hardware that’s under debug.
There are no major requirements here: as long as the dongle is supported by OpenOCD, you should be good.
-
OpenOCD
This is probably the most important piece of the whole debug flow.
OpenOCD has support for almost all common JTAG dongles, and provides a generic JTAG API to issue commands to them.
The generic JTAG API is controlled by a VexRiscv specific target driver. The OpenOCD VexRiscv driver knows exactly what needs to be be sent over JTAG to transfer debug commands through the JtagBridge to the debug logic of the CPU.
At the top of the OpenOCD stack is a GDB server that supports the GDB remote target debug protocol.
The overall operation of OpenOCD consists of receiving high-level debug requests from GDB, translating this into VexRiscv specific JTAG transactions, and sending these transactions to a specific JTAG dongle.
The VexRiscv debug infrastructure is not compatible with the standard RISC-V Debug Specification. You have to use
openocd-riscv, the custom version of OpenOCD with VexRiscv functionality. The changes of this custom version have not been upstreamed to the official OpenOCD repo! -
GDB
GDB is reponsible for loading code, managing breakpoints, starting and halting a CPU, stepping to the next assembler instructions or the next line of code etc.
When used in a remote debug configuration, as is the case here, GDB does not need to the know the low level specifics of the CPU that’s under debug. All it needs to know is the CPU family: how many CPU registers, function calling conventions, stack management, etc.
The low level details are handled by OpenOCD instead. Because of this, you can use a RISC-V GDB that is part of a standard RISC-V GCC toolchain. There is no need for a VexRiscv-specific GDB version. I’m using the RISC-V toolchain from the SiFive Freedom Tools.
-
IDE
This can be an editor with built-in debug capabilties such as Eclipse or VSCode. It can be stand-alone debugger gui such as gdbgui. Or it can be TUI, the GUI that’s built into GDB itself.
The IDE is optional: you can just enter commands straight in the GDB command line. The GDB version of the SiFive Freedom Tools has TUI support disabled.
There’s a lot going on while debugging a program on an embedded CPU!
Luckily, it’s not necessary to understand all the details. Most of you are really only interested in using the system. So let’s start with that: get a mimimal design with a CPU running on an FPGA, and try to a debug environment working.
A Minimal CPU System
Let’s demonstrate a VexRiscv with a debugger on a minimal design that consists of a VexRiscv CPU (with debug plugin, of course), a bit of RAM for CPU instructions, and data, and some registers to control LEDs and read back the value of button.

You can find all the code for this blog post in my
vexriscv_ocd_blog repo on GitHub.
VexRiscv Verilog
I normally write all my hobby RTL code in SpinalHDL, but to make it easier for others
to use this design as an example, I wrote the toplevel,
top.v in pure Verilog,
and had SpinalHDL create a stand-alone
VexRiscvWithDebug.v
Verilog file that contains the CPU and the JTAG debug logic. As long as you don’t feel the need to make
changes to the CPU configuration, you don’t have to install anything related to SpinalHDL.
VexRiscv configuration
The VexRiscv can be configured into a thousand different ways. The exact details of the CPU system that’s used in this example aren’t very important, so to avoid this article to become too long, you can read about them here.
There’s also a functional testbench to check that the basic design is sound.
System Setup with a Generic JTAG Debug Interface
In the most straigthforward setup, pins for the CPU debug JTAG interface are routed from the FPGA core logic to general purpose FPGA IO pins, as shown in the diagram below:

The disadvantage of this configuration is that you end up with two separate paths from your PC to the FPGA board: one to load the bitstream into the FPGA and one to debug the CPU. Generic IO pins are often precious and it’s painful to waste 4 of them just for debugging.
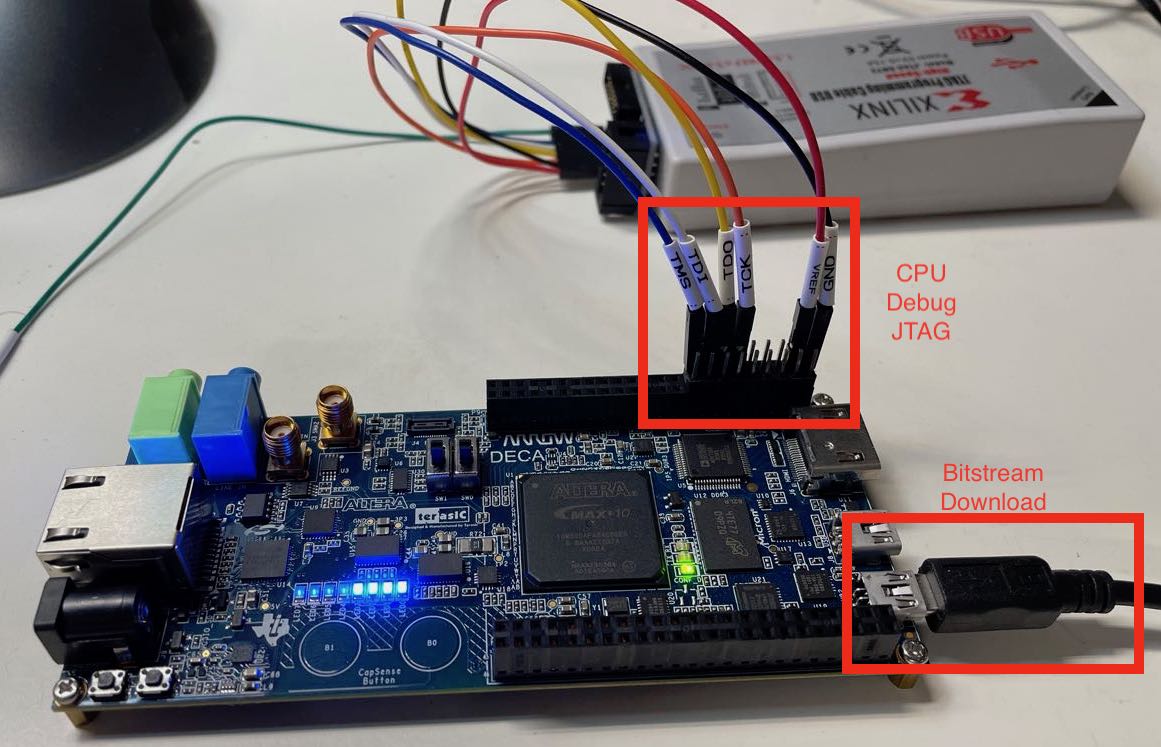
But it has the benefit of being completely generic and universal: it will work on any FPGA board and FPGA type.
There is an alternative: with the notable exception of the Lattice ICE40 family, almost all FPGAs have have a way for the core programmable logic to tie into the JTAG TAP that’s already part of the FPGA. Intel has a virtual JTAG infrastructure, Xilinx has the BSCANE primitive cell, and the Lattice ECP5 family has the JTAGG primitive cell. With a bit of additional logic and corresponding support in OpenOCD, it’s possible to create a system with just one cable.

The SpinalHDL and the VexRiscv version of OpenOCD have support for some of these options. The VexRiscv repo even contains a detailed description about how to do this for a Xilinx FPGA.
However, for the remainder of this article will deal with the generic option only.
Building the Design for FPGA
For this project, I used the $37 Arrow DECA FPGA board that I reviewed earlier. It’s one of the best deals in town!
You can find the configuration files for the example project here.
The example design has the following external IOs:
-
clk: an external clock input.On the Arrow DECA, this clock is 50MHz. The design doesn’t use any PLL to create a different clock. Due to some internal VexRiscv design decisions, the CPU clock must be higher than the JTAG clock!
led0,led1,led2: the CPU will toggle these LEDs in sequence.button: when pressed, the LEDs toggling sequence doubles in speed-
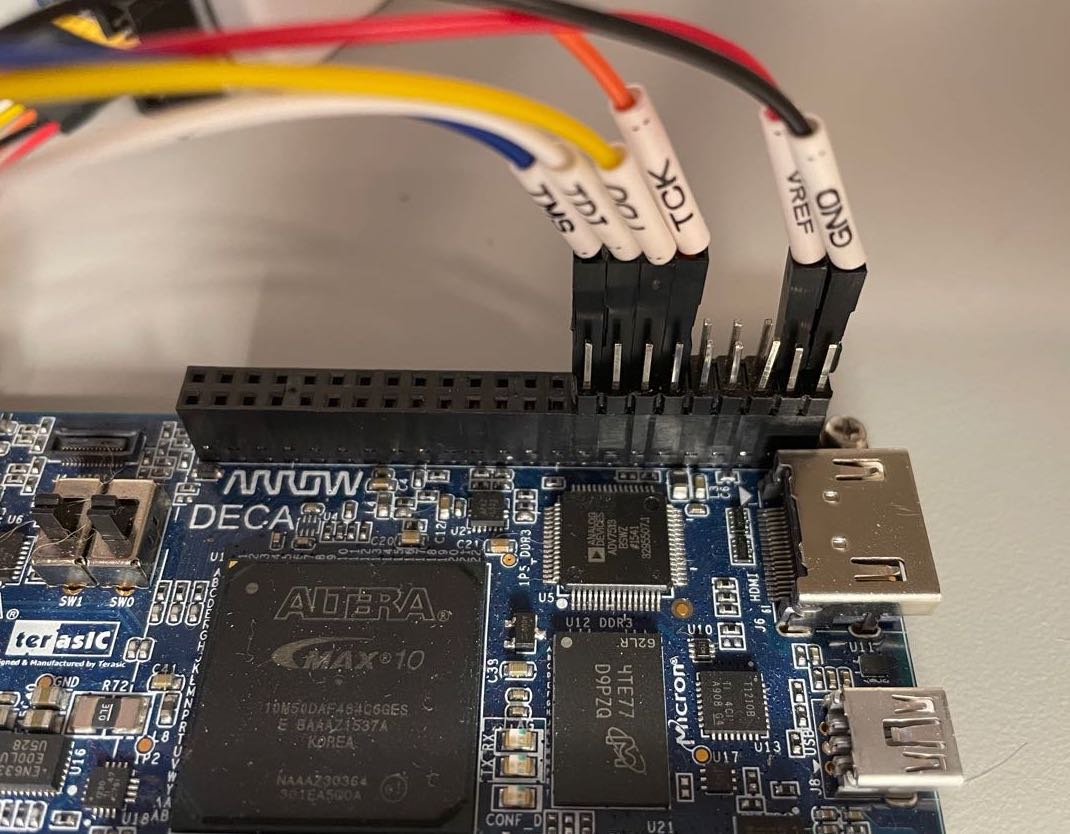
jtag_tck,jtag_tms,jtag_tdi,jtag_tdo: the generic JTAG interfaceThe JTAG IOs are assigned to pins of the P9 connector of the DECA board, as seen in the closeup picture below:
In addition to the project files, I’ve also provided ready-made
vexriscv_ocd.sof
bitstream so you can try things out right away.
Debug Logic Resource Cost
Adding debug logic is not free, but the cost is very reasonable.
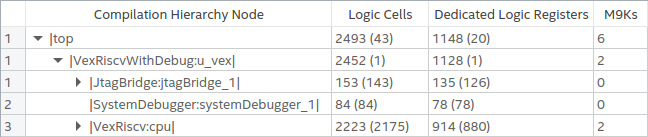
On the Intel Max 10 FPGA using Quartus Prime 20.1 Lite Edition, the resource usage for the complete design with JTAG debug enabled is 2493 logic cells and 1148 flip-flops.
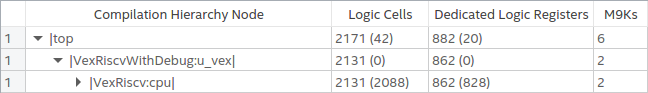
When JTAG is disabled by strapping IO input pins constant value, and TDO is left dangling, Quartus does an excellent job at optimizing all debug logic out, and the resource usage drops to 2171 logic cells and 882 flip-flops.
The resource usage for a VexRiscv CPU, with or without DebugPlugin, is heavily dependent on which features are enabled. A good example is CSR related functionality (these are special register inside a RISC-V CPU to deal with interrupts, traps, instruction counters etc.) The logic behind these is often straightforward, but they can consume a lot of FFs. The CPU I’m using here has a number of trap exception support enabled, and that costs more than 100 FFs.
Conclusion: adding debug logic increases the resource usage around 15%. That seems high, but it’s more a testament to how small the VexRiscv really is. If you were to enable the HW multiplier and divider, instruction and data caches, and MMU, the percentage of the debug related logic would go descend into low single digits.
Compiling the Custom OpenOCD Version
As mentioned earlier, you’ll need a custom version of OpenOCD.
The instructions below worked on my Ubuntu 20.4 Linux distribution. Note also how I specify
an installation directory of /opt/openocd_vex. Change that to your own preferences…
sudo apt install libtool automake libusb-1.0-0-dev texinfo libusb-dev libyaml-dev pkg-config
git clone https://github.com/SpinalHDL/openocd_riscv
cd openocd_riscv
./bootstrap
./configure --prefix=/opt/openocd_vex --enable-ftdi --enable-dummy
make -j $(nproc)
sudo make install
Connecting to the JTAG TAP of the FPGA
It’s now time to set everything up for SW debugging on a live FPGA system.
We first need to be able to access the debug JTAG TAP from our PC.
There are 3 things that need to be in place:
-
the JTAG pins of the dongle must be connected to the right FPGA pins
Do that first, while the FPGA board is powered off.
-
the FPGA must have the bitstream loaded with the JTAG TAP logic
Do that next. If you’re using my example design, you should see 3 LEDs blinking one after the other.
-
an OpenOCD configuration file that loads the right JTAG dongle driver
I personally dread step number 3 the most: when everything has been set up correctly, you don’t need to
use sudo when running OpenOCD, and hopefully you find the right driver, but it’s never a sure thing.
Either way, I wrote a blog post in the past about loading a Xilinx Spartan 6 bitstream with OpenOCD that explains the process.
In my case, I’m using a Xilinx Digilent JTAG SMT2 clone. This is the magic incantation:
/opt/openocd_vex/bin/openocd \
    -f interface/ftdi/digilent_jtag_smt2.cfg
    -c "adapter speed 1000; transport select jtag"
    -f "./sw/vexriscv_init.cfg"
Open On-Chip Debugger 0.10.0+dev-01231-gf8c1c8ad-dirty (2021-03-07-17:49)
Licensed under GNU GPL v2
For bug reports, read
	http://openocd.org/doc/doxygen/bugs.html
jtag
Info : set servers polling period to 50ms
Info : clock speed 1000 kHz
Info : JTAG tap: fpga_spinal.bridge tap/device found: 0x10001fff (mfg: 0x7ff (<invalid>), part: 0x0001, ver: 0x1)
Info : starting gdb server for fpga_spinal.cpu0 on 3333
Info : Listening on port 3333 for gdb connections
Halting processor
requesting target halt and executing a soft reset
Info : Listening on port 6666 for tcl connections
Info : Listening on port 4444 for telnet connections
Success!
We were able to connect to the JTAG TAP, we were able to connect to the CPU, and we were able to halt it. On your FPGA development board, you should have noticed that the LEDs are not blinking anymore.
OpenOCD also opened a GDB server on port 3333. Soon, we’ll be executing debug instructions to the CPU from GDB through this TCP/IP port to OpenOCD which will translate them instead JTAG commands.
You can run the OpenOCD command above by running make ocd_only in the ./sw directory.
The vexriscv_init.cfg file
Notice above that I added -f ./sw/vexriscv_init.cfg as a command line parameter when starting openocd.
The vexriscv_init.cfg
file sets up parameters that are specific to the VexRiscv configuration of our design.
In addition to some standard OpenOCD commands that set up JTAG TAP configuration and debug targets, this file also has some VexRiscv specific commands:
vexriscv readWaitCycles 10
...
vexriscv cpuConfigFile ../spinal/VexRiscvWithDebug.yaml
The custom OpenOCD version can be configured to deal with configurations that have multiple VexRiscv CPUs
attached to a single JTAG TAP. It can also handle HW breakpoints, cache invalidation and more. But it needs
to know about this, and the vexriscv commands are used for that.
For this simple example, let’s just ignore this and use some defaults that work.
Debugging with Barebones GDB
OpenOCD should already be up and running in one terminal window. Open a second one to run GDB, then do the following:
cd ./sw
make gdb_only
You should see something like this:
/opt/riscv64-unknown-elf-toolchain-10.2.0-2020.12.8-x86_64-linux-ubuntu14/bin/riscv64-unknown-elf-gdb -q \
        progmem.elf \
	-ex "target extended-remote localhost:3333"
Reading symbols from progmem.elf...
Remote debugging using localhost:3333
0x000001e0 in wait_cycles (cycles=0) at lib.c:38
38	    while ((rdcycle64() - start) <= (uint64_t)cycles) {}
(gdb)
We called GDB with the following parameters:
-qto make it not print a GPL license headerprogmem.elfto give GDB information about the program that’s currently running on the CPU-ex "target extended-remote localhost:3333"to tell GDB to connect to the OpenOCD server that’s running in our other terminal.
GDB complied with our request, and also showed the line in the C code where the CPU has been halted. The code
spends the vast majority of its time until a timer expires, to slow down the LED toggle rate, so it’s no
surprise to see wait_cycles() listed here.
You can now do bunch of GDB commands:
- Continue where GDB left off
(gdb) c
Continuing.
- Load the program binary again, set a breakpoint, reset the CPU, and rerun from start, continue after break:
(gdb) load
Loading section .text, size 0x202 lma 0x0
Start address 0x00000000, load size 514
Transfer rate: 4112 bits in <1 sec, 514 bytes/write.
(gdb) br main
Breakpoint 1 at 0x102: file main.c, line 55.
(gdb) monitor soft_reset_halt
requesting target halt and executing a soft reset
(gdb) c
Continuing.

Program stopped.
main () at main.c:55
55	    global_cntr = 0;
(gdb) c
Continuing.
If you’ve ever used GDB without GUI to debug programs on your PC, everything should be very familiar.
You can use make gdb to launch both OpenOCD and GDB at the same time. In that case, there’s no
need to first run make ocd_only and make gdb_only.
Debugging with gdbgui
GDB is very powerful, but when browsing through a running program, the lack of a traditional debug GUI can be limiting. GDB from the SiFive toolchain isn’t compiled with the built-in GUI, named TUI, enabled, so an external one is needed.
There are many options, but I’ll show here how to use gdbgui. gdbgui is a python script that connects to a GDB server on one hand and creates an HTML server on the other. You use your browser to render the GUI, so it works for pretty much any OS.
Installation is simple:
pip3 install gdbgui
For some reason, I wasn’t to get it work with openocd being launched together with gdbgui, so I had to do it in two steps.
In one terminal:
cd ./sw
make ocd_only
In the other:
cd ./sw
make gdbgui
If all goes well, you should see something like this:
gdbgui -g '/opt/riscv64-unknown-elf-toolchain-10.2.0-2020.12.8-x86_64-linux-ubuntu14/bin/riscv64-unknown-elf-gdb -q progmem.elf -ex "target extended-remote localhost:3333"'
Opening gdbgui with default browser at http://127.0.0.1:5000
View gdbgui dashboard at http://127.0.0.1:5000/dashboard
exit gdbgui by pressing CTRL+C
On my Ubuntu system, a Firefox page automatically opened. I had to click “Retry”, but after that, a familiar debug environment showed up:
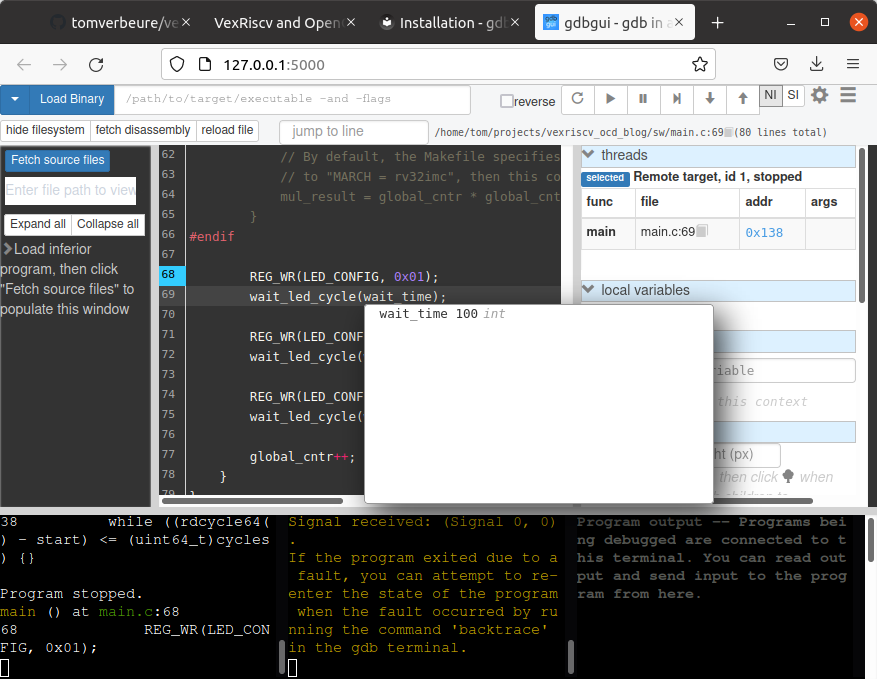
Things are not perfect: sometimes, it seems the GUI and the command line interface of GDB (the bottem left
rectangle) get out of sync, and you need to issue the interrupt command or load and monitor soft_reset_halt
commands to get things going again.
But overall, it works well enough.
VexRiscv Traps
There are many reasons why a VexRiscv can issue an exception or a trap:
-
instruction fetch error
This happens when the iBus returns a bus error. In my example, this happens when the CPU tries to fetch an instruction from an address that falls outside the range of the RAM.
-
data bus fetch error
Similar to an instruction fetch, this happens when dBus returns a bus error. My example never asserts a dBus error and simply has the signal strapped to zero.
-
load/store misaligned trap
This happen when loading or storing, say, a 32-bit value from an address that’s not 32-bit aligned.
-
illegal instruction error
This happens when the CPU is asked to execute an unknown instruction. A typical example of this is when a RISC-V CPU that doesn’t support a HW multiplier is asked to execute a MUL instruction.
-
EBREAK instruction
An EBREAK instruction will force the CPU to trap. This is commonly used by a debugger to to create software breakpoints all over the code.
… and many more.
The VexRiscv can be configured to raise traps for all these different exceptions, upon triggering such an exception, when enabled, it will jump to a trap handler that’s located at the address that’s stored in the machine trap-vector base-address or CSR.MTVEC register. (See section 3.1.7 of the RISC-V privileged specification.)
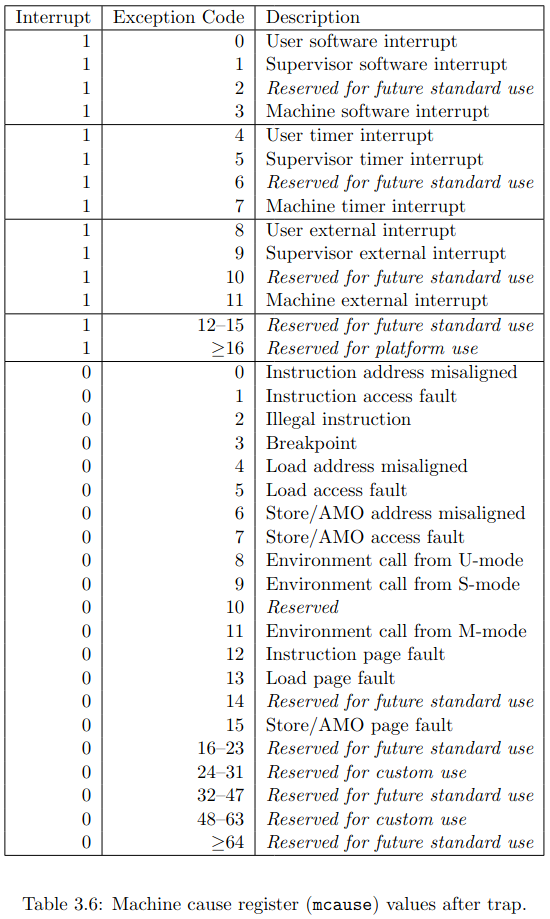
At that point, the trap handler can use the CSR.MCAUSE register (section 3.1.16 of the RISC-V privileged specification) to figure out the reason why the trap handler was called, and deal with it as needed.
Under normal circumstances, when a debugger is not connected, the VexRiscv will jump to a trap handler when a supported exception is triggered, but the CPU will continue running. However, when a debugger has been connected at least once, and an EBREAK instruction is encountered, the CPU will halt, and wait for the debugger to issue further instructions.
Stated differently: when the VexRiscv sees an EBREAK instruction, but a debugger has never been connected (more technically: OpenOCD was never asked to connect to the DebugPlugin), the EBREAK instruction will cause a call to the trap handler, and it will NOT halt the CPU.
Exceptions other than EBREAK will never halt the CPU.
The reason I’m bringing this up is because when there’s non-EBREAK trap, I often want the CPU to trap and record the problem, but when the debugger is connected, I also want the debugger to halt and tell me that there was a trap. I do this by forcibly inserting an EBREAK instruction in the trap handler itself. Let’s discuss that next…
Forcing the Trap Handler to Halt the CPU
Traps can be extremely useful to figure out embedded firmware issues. An all too common problem is running out of stack space, which results in overwriting CPU instructions and the program going completely off the rails. Instruction fetch exceptions are very good at detecting case like that.
So here’s how I deal with that:
- I configure the VexRiscv to catch illegal instruction fetches, to catch illegal data fetches, or to catch misaligned data fetches. I also make it trap on catching illegal instructions.
- I set up a low level trap handler that saves the execution context, and then calls a C-code trap handler.
- The C trap handler saves the information about what caused the initial trap. However, this wouldn’t halt a connected debugger! On an embedded system, you might not notice that the CPU has seen an exception.
- To make sure the debugger halts, I then execute an EBREAK instruction. This will halt the CPU immediately, but only when a debugger is connected. When no debugger is connected, it will generate a new trap. So to prevent that you get an endless sequence of EBREAK induced traps, I make sure that it will only happen once, by setting and checking a guard variable.
You experiment with this by changing the #if 0 in main.c
to #if 1 and recompiling the code.
#if 1
        if (!REG_RD_FIELD(STATUS, BUTTON)){
            // Jump to an address that falls outside instruction RAM.
            // This will result in a bus error, and thus a trap.
            void (*func)(void) = (void (*)(void))0x00004000;
            func();
        }
#endif
Once you press the button on the DECA board now, the code will jump to a non-existent function in a non-existent RAM location at address 0x4000. This will create a instruction bus error and thus a trap.
(gdb) monitor soft_reset_halt
requesting target halt and executing a soft reset
(gdb) load
Loading section .text, size 0x22a lma 0x0
Start address 0x00000000, load size 554
Transfer rate: 4432 bits in <1 sec, 554 bytes/write.
(gdb) c
Continuing.

Program stopped.
trap () at trap.c:37
37	        asm volatile (
(gdb) p/x exception_addr
$1 = 0x4000
(gdb) p/x exception_instr
$2 = 0x4000
(gdb) p/x exception_cause
$3 = 0x1
(gdb)
You can see that the first exception trapped at address 0x4000, as expected. The exception cause was 0x1, which, according to the table shown above, corresponds to “Instruction access fault”.
There’s More to Traps than Just Catching Errors
So far, I’ve only discussed traps in the context of flagging errors. There’s much more to it. One very common use case is to use traps to implement missing HW instructions in software: you detect that an unsupported MUL instruction resulted in a trap, the trap handler does the multiplication in software, and program execution returns as if nothing happened.
I also didn’t discuss trap vector addresses: my example has 1 trap address for a trap handler that is supposed to handle all different trap types (and interrupts too), but RISC-V supports specifying different trap handlers for different types of exceptions and interrupts.
A very intriguing and little known use case of traps is semihosting, where the embedded CPU leverages the host PC on which OpenOCD is running to implement terminal and file system operations. This is something that will be discussed in a future blog post.
Conclusion
In the past, setting up an FPGA with a soft-core for debugging always seemed too much hassle. But once I tried it, it turned out to be pretty straightforward. If you have 4 IO pins to connect a JTAG dongle, it’s really as easy as installing a few pieces of software, and having the right rules in a Makefile. On a VexRiscv, the hardware cost is low too.
With a little bit of extra infrastructure and some additional trap handling code, I can now debug some issues much quicker than before. Give it a try!