From Microphone Datasheet to Filter Design Specification
- Introduction
- Making Sense of Microphone Datasheet Numbers
- PDM to PCM Design Requirements
- Stop Band Attenuation for a Decimation Filter
- PDM to PCM First Try: Just Filter the Damn Thing!
- Conclusion
- References
Introduction
If you’ve read my previous three posts in this series, you know that I’m improving my general DSP knowledge by applying it to a concrete example of taking in the single-bit data stream of a PDM microphone and converting it into standard PCM samples.
The application itself is only a means to an end. Most important is understanding the why and how of every design decision along the way: if there’s, say, a filter with a 70dB stop band attenuation at 10kHz, I want to know the justification for that.
After diving into CIC filters, the characteristics of the sigma-delta generated PDM signal of a MEMS microphone, and learning how to come up with FIR filter coefficients in general, the time has come to start building up the filter architecture.
And for that, we need to come up with a design specification!
More than ever: take everything here with a grain of salt! And please contact me via Twitter or GitHub if you notice any mistakes.
Making Sense of Microphone Datasheet Numbers
The problem that I want to solve is to convert a PDM signal to a PCM signal while maintaining the quality level of the microphone.
Going forward, I’ll use the characteristics of the ST MP34DT01-M microphone of my Adafruit test board and let them guide the specifications of the filter design.
ST seems to have left the PDM microphone market, but luckily, Adafruit still carries the datasheet. The most important characteristics are marked in red:
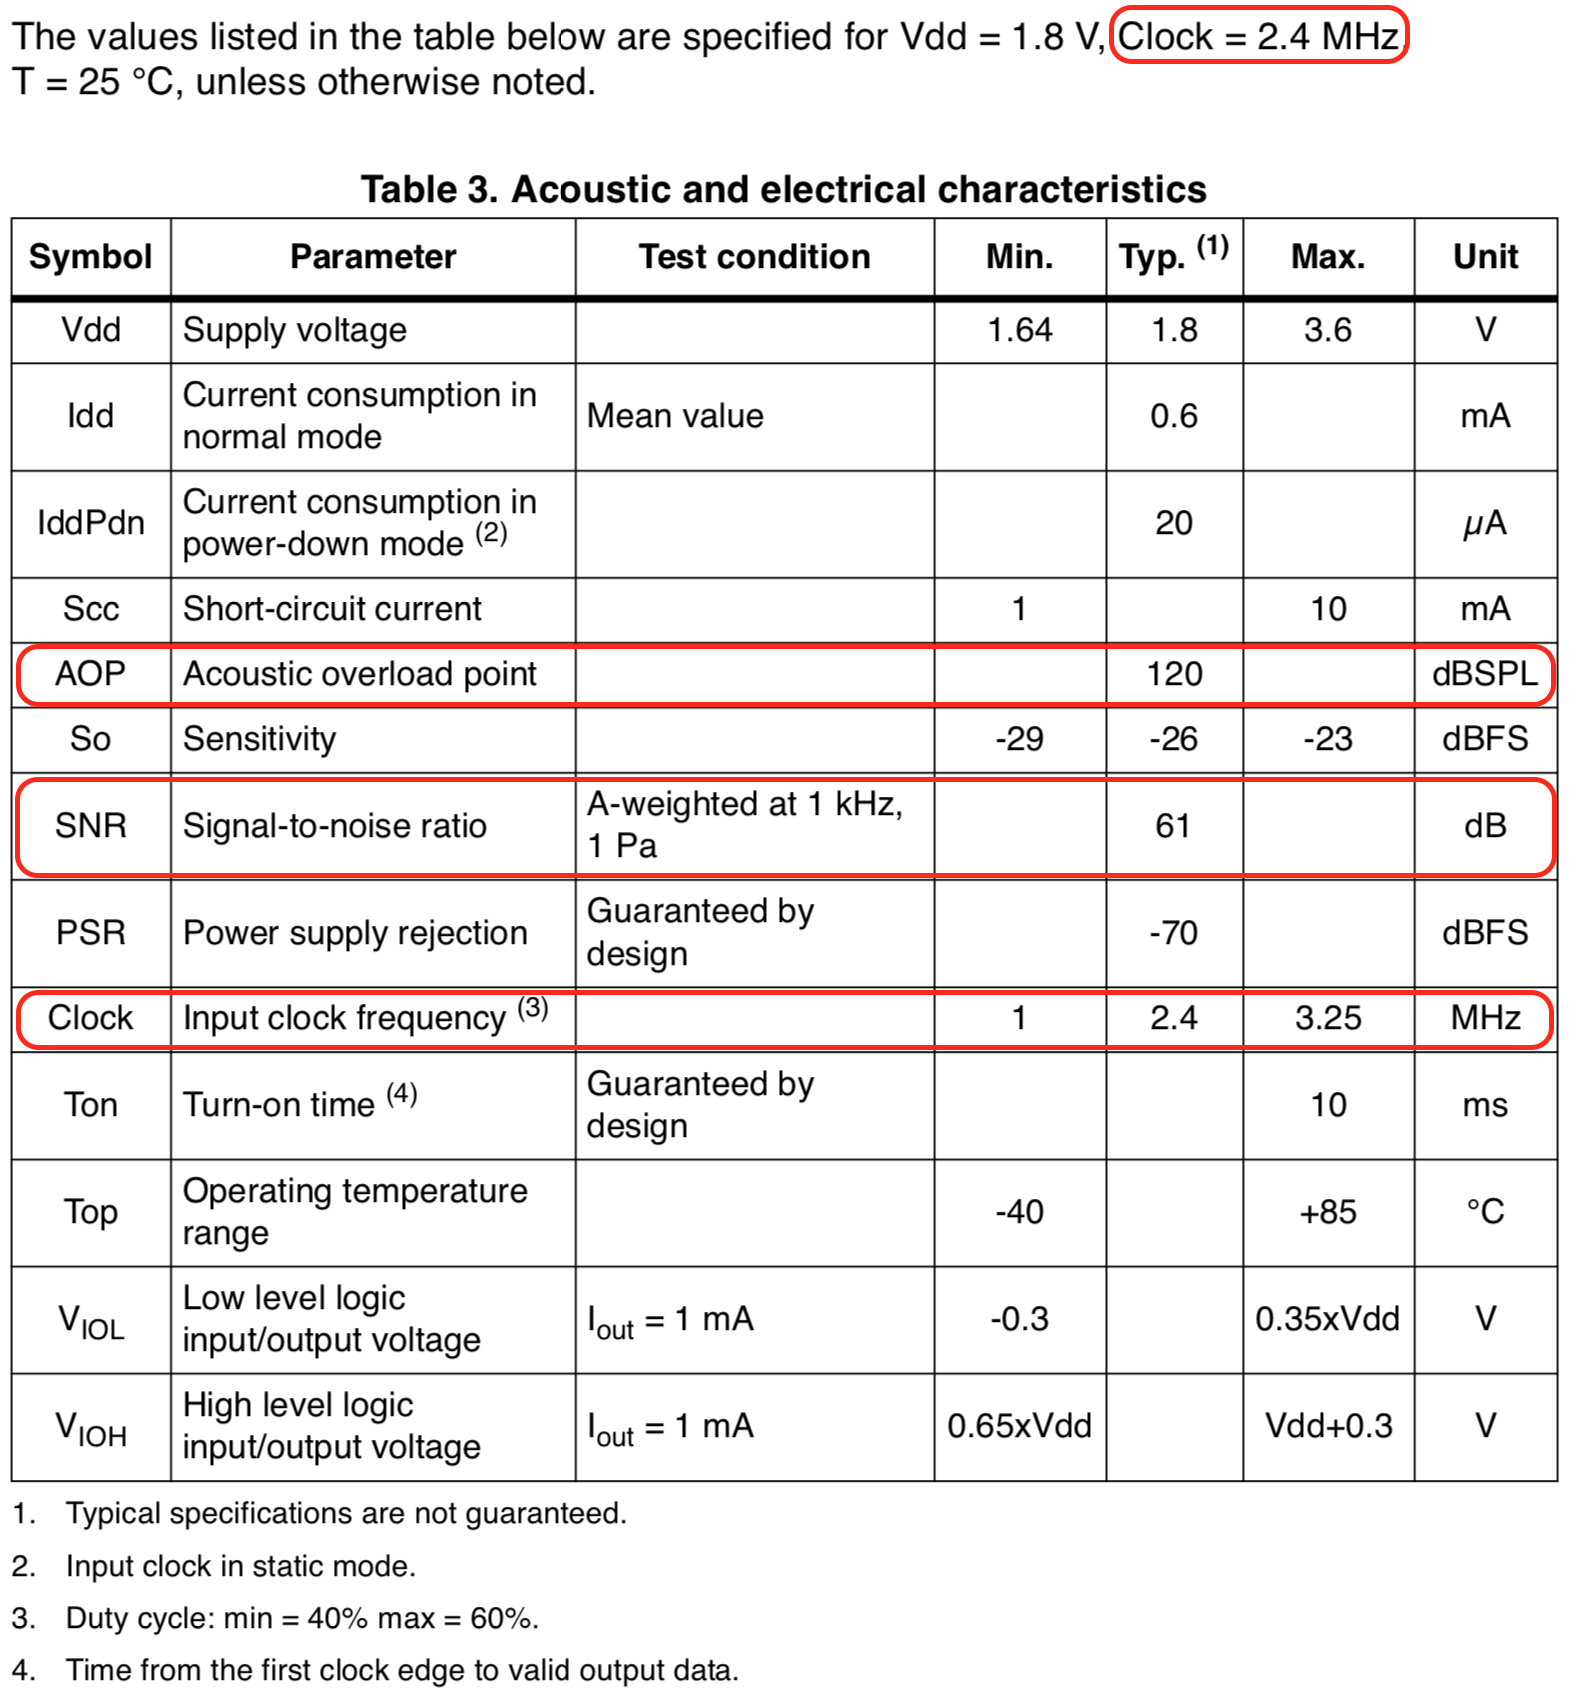
When I see “SNR” and “AD converter”, I think “dynamic range” and the number of bits that I need to make sure that my logic can cover the full signal range: 1 bit is good for ~6dB.
For example, 16-bit CD quality audio supports a theoretical maximum SNR of 96dB.
So when the datasheet of my microphone showed an SNR of 61dB(A), I initially assumed that you get what you pay for: a cheap device with crappy dynamic range.
And I couldn’t have been more wrong!
If you want the gory details, you should read the Microphone Specifications Explained application note from InvenSense. Another good (and shorter) document is Infineon’s Digital encoding requirements for high dynamic range microphones, which discusses the relationship between microphone specifications and the word size needed to capture the full dynamic range of a microphone. (Just what I need!)
But I’ll give a very short summary here.
Acoustic Overload Point
A microphone datasheet lists the loudest 1kHz sine wave that it can more or less reliably record. This is called the acoustic overload point (AOP). A common way to quantify “reliably record” is with a total harmonic distortion (THD) of 10% or less.
Our microphone has an AOP of 120 dbSPL, where dbSPL stands for decibel sound pressure level.
It also shows that 120 dbSPL corresponds to a THD of 10%:
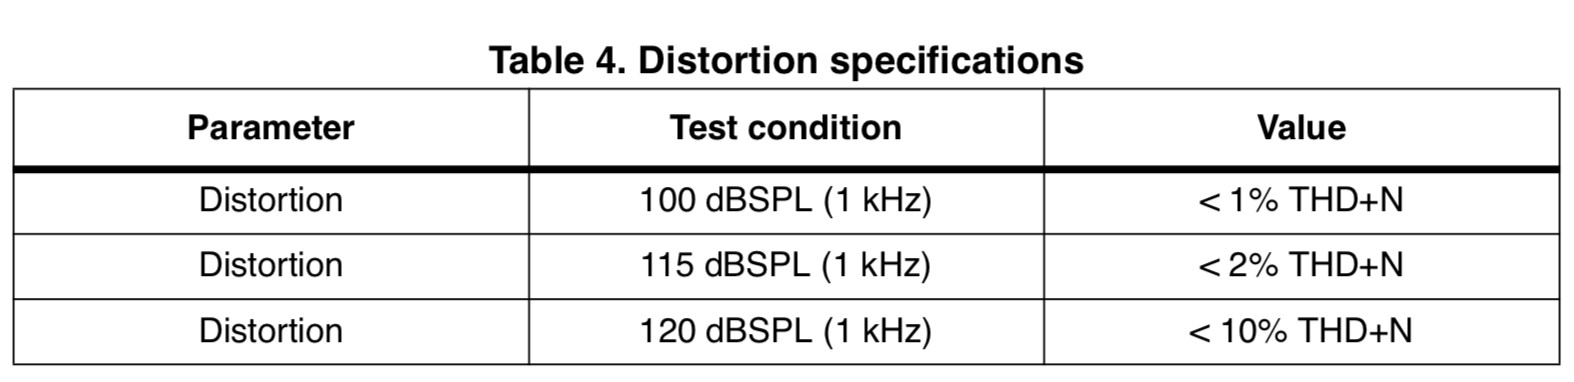
According to Wikipedia, 120 dbSPL is about as loud as having the bane of the 2010 World Cup, the vuvuzela, screaming at you from a 1m distance.

The digital output of a microphone should be at maximum at the AOP. This is full-scale value. All other sounds (with some exceptions) will result in a lower digital output value. The unit to measure this is dbFS, decibels relative to full scale. At the AOP, dbFS is 0. All other levels have a negative dbFS number.
Signal to Noise Ratio
The signal to noise ratio of a microphone quantifies the internal noise of the microphone, and thus the boundary for which sound can be recorded.
However, the number is not relative to the AOP but to a 1kHz sine wave with a sound pressure of 94 dBSPL. Don’t get confused by the fact that our datasheet lists SNR for a sound pressure of 1 Pa: that corresponds exactly to 94dBSPL.
The SNR measurement goes as follows:
- first they record the output of the microphone with this 1kHz 94dBSPL reference sine wave
- then they put the microphone is a fully silent environment, and record the output again. This noise output is corrected by an A-weighting curve, which adjust for the human ear’s frequency sensitivity.
- finally, they subtract these 2 numbers.
Dynamic Range
We now have 2 numbers: AOP, which is the maximum sound pressure, and SNR, which is relative to a sound pressure of 94dBSPL.
The dynamic range of the microphone is the SNR plus the difference between the AOP and 94dbSPL.
In our case: 120dBSPL (AOP) - 94dBSPL (SNR reference) + 61dB (SNR) = 87dB.

At ~6dB per bit, our design will need a PCM word size of at least 15 bits to cover the full dynamic range of the microphone. The desired dynamic range also impacts the performance parameters of the filters that are needed for PDM to PCM signal conversion.
PDM to PCM Design Requirements
We can finally move on the requirements of our design:
-
An output sample rate of 48kHz.
48kHz is universally supported and probably the most common sample rate for high quality audio, though it’s obviously overkill for a microphone that only goes up to 10kHz.
-
2.304 MHz PDM sample rate.
The microphone supports a PDM clock rate between 1 and 3.25MHz.
There are some very efficient filters that are perfect for 2x decimation, so it’s best to select a ratio that is divisable by some power of 2.
The acoustic and electrical characteristics in the datasheet are given for 2.4MHz, but 2400/48=50, which is only divisable by 2. So let’s choose 2.304MHz: 2304/48=48, which is in turn divisable by 16. Perfect!
-
A passband from 0 to 6kHz.
Some MEMS microphones have a sensitivity curve that goes all the way up to 20kHz, but this microphone definitely does not fall in that category. The frequency response is only flat between 100Hz and 5kHz, after which it starts going up. And there’s no data above 10kHz.
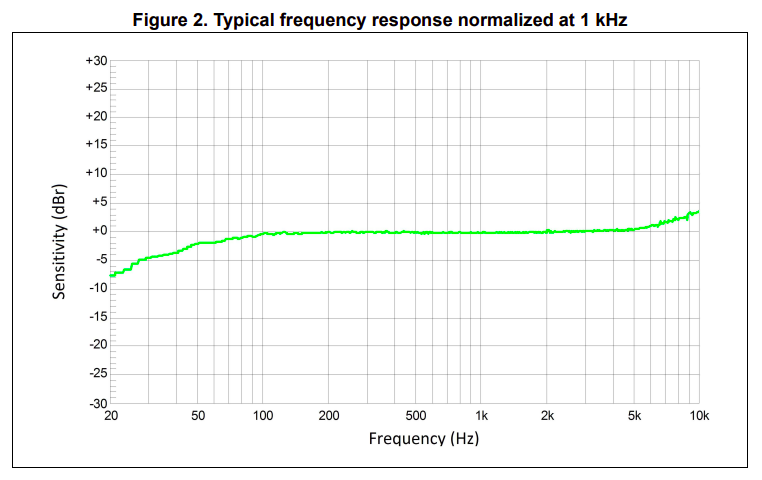
6kHz seems like a good point to start the transition band.
-
A stop band that starts at 10kHz.
Since the specification of the microphone doesn’t say anything about behavior above 10kHz, I’m simply assuming that this is no-go territory, so that’s where the stop band will start.
-
An output signal with a SNR of 86dB.
In the previous section, I derived a microphone dynamic range of 87dB.
Decimation will alias higher frequencies into the final frequency band. Since perfect filters don’t exist, the noise of the stop band will inevitably reduce the SNR of the final signal.
I’m allowing a 1dB SNR deterioration, which is not a lot, and it will put quite a bit of strain onto the filter design. This will soon be discussed in depth.
-
The maximum ripple I’m willing to accept in the passband at the output is 0.1dB.
This seems to be a pretty typical requirement for high quality audio.
In a decimation filter architecture with more than 1 filter, each successive filter will impact the passband ripple. As a result, individual filters will need to have a tighter specification than this overall ripple.
Stop Band Attenuation for a Decimation Filter
I already wrote about the Basics of Decimation earlier, but didn’t mention one of the most important parts:
Higher decimation ratios require higher stop band attenuation to get the same noise floor.
In the example below, you can see what happens when you keep the stop band attenuation of a decimation filter the same for different decimation ratios:

Of interest here is the amount of unwanted aliasing noise (red) that is added underneath the signal of interest (green) after decimation. In the 2x decimation case, only 1 ‘unit’ of stop band noise is added, while it’s 3x that for the 4x decimation case. In general, the amount of noise added is (n-1), where n is the decimation ratio, 48 in our case.
Once noise ends up in the frequency range of the signal of interest, it can never be removed.
If we want the amount of aliasing noise to be the same for the 2x and the 4x decimation, we have to increase the stop band attenuation of the 4x decimation filter by 3x compared to the 2x decimation filter.
Let’s now work the numbers for our microphone case.
-
microphone dynamic range: 87dB.
-
output dynamic range: 86dB.
-
decimation ratio: 48x.
-
PDM noise level above 24kHz: -20dB or less
This is almost certainly wrong, but I expect it to be pessimistic with some additional margin.
Recall the noise slopes of various sigma-delta converters from my earlier blog post:

The noise floor here does not go above -30dB.
-
Difference between input and output dynamic range: 1dB (87dB - 86dB)
-
Number of upper frequency bands that are aliased onto the main signal: 47 (48-1)
-
Combined power of the aliased noise if there’s no filter: -3dB
P_aliasing_noise_before = 10^(-20dB/10) * 47 P_aliasing_noise_before_db = -20dB + 10*log10(47) P_aliasing_noise_before_db = -20dB + 17dB = -3dB. -
Required stop band attenuation: 89dB
  SNR_signal_before + P_aliasing_noise_after = SNR_signal_after

  10^(-87/10) + 10^(P_aliasing_noise_after_db/10) = 10^(-86/10)
  10^(P_aliasing_noise_after_db/10) = 10^(-86/10) - 10^(-87/10)
  P_aliasing_noise_after_db = 10 * log10( 10^(-86/10) - 10^(-87/10) )
  P_aliasing_noise_after_db = -92dB
  A_stop_band = P_aliasing_noise_before    / P_aliasing_noise_after
  A_stop_band = P_aliasing_noise_before_db - P_aliasing_noise_after_db
  A_stop_band = -3dB - (-92dB) = 89dB
PDM to PCM First Try: Just Filter the Damn Thing!
Do we really need a complex filter architecture to convert PDM to PCM? Maybe a single equiripple filter is sufficient for our needs?
Let’s just fill in the numbers, run the remez algorithm that was discussed in
my previous blog post,
and see what happens:
...
Trying N=2212
Rpb: 0.013681dB
Rsb: 88.912090dB
Trying N=2213
Rpb: 0.013842dB
Rsb: 88.953522dB
Trying N=2214
Rpb: 0.013998dB
Rsb: 88.987672dB
Trying N=2215
Rpb: 0.014158dB
Rsb: 89.034898dB
Filter order: 2215
After more than a little while, it comes up with a filter that has 2216 taps, and the following frequency response graph:

Since this is a decimation filter, we only need to evaluate it for each output sample.
The number of multiplications per second becomes:
48000 * 2216 = 106M muls/s (48x decimation - from 2304 to 48kHz)
That’s a lot, but that’s good if you’re looking for a baseline and want to impress people about how you were able to optimize your design!

Note that even if the remez function seems to have found a solution, upon closer look, the result looks suspicous: the very first coefficient (and the very last one, since it’s symmetric) have a weird bump.
I suspect that this due to rounding errors. So even if you can stomach the 110M multiplications/s, chances are that the result won’t be right. (I didn’t pursue this further.)
Conclusion
We have finally have a design specification and can now start looking at practical design implementations.
A naive first try at solving everything with a single filter didn’t work out, but there a lot of ways to optimize the design into something that will work.
References
My Blog Posts in this Series
- An Intuitive Look at Moving Average and CIC Filters
- PDM Microphones and Sigma-Delta A/D Conversion
- Designing Generic FIR Filters with pyFDA and NumPy
- From Microphone Datasheet to Filter Design Specification
- Half-Band Filters, a Workhorse of Decimation Filters
- Design of a Multi-Stage PDM to PCM Decimation Pipeline
Microphones
Decimation Stop Band Attenuation
-
dsp.stackexchange.com is a great resource to ask questions when you need clarification on something!
Code