PDM Microphones and Sigma-Delta A/D Conversion
- Introduction
- PDM MEMS Microphones
- PDM Interface
- Pulse Code Modulation and Quantization Noise
- From Analog Signal to PDM with a Sigma-Delta Converter
- Simulating Sigma-Delta Converters
- Higher Order Sigma-Delta Converters
- Increasing the Oversampling Rate
- High Frequency Noise Level Depends on Sigma Delta Order
- PDM and Sigma-Delta Converters Summary
- The Road from PDM to PCM
- Coming Up
- References
Introduction
As part of my ongoing quest to learn more about digital signal processing, I’ve been reading on and off about MEMS microphones, pulse density modulation (PDM), conversion from PDM to pulse code modulation (PCM), and various audio processing techniques and interfaces.
The best way to learn something is by doing (and then writing about it), so in this series of blog posts, I’ll be talking about an FPGA project that takes in the PDM data stream from the microphone, and sends it out in PCM format over an SPDIF interface.
In this installment, I’m looking at the audio source: a MEMS microphone.
As always, keep the usual disclaimer in mind: these blog posts are a way for me to solidify what I’ve learned. Don’t take whatever is written below as gospel, there may be significant errors in it!
PDM MEMS Microphones
MEMS microphones can be found in all modern mobile phones. They are very small in size, are low cost, have low power consumption, offer decent quality, and can be mounted to a PCB with a standard surface mounted assembly process.
Some MEMS microphones transmit the audio data in PCM format over an I2S interface, but most use 1-bit pulse density modulation, leaving it up to the host chip to do the PDM to PCM conversion.
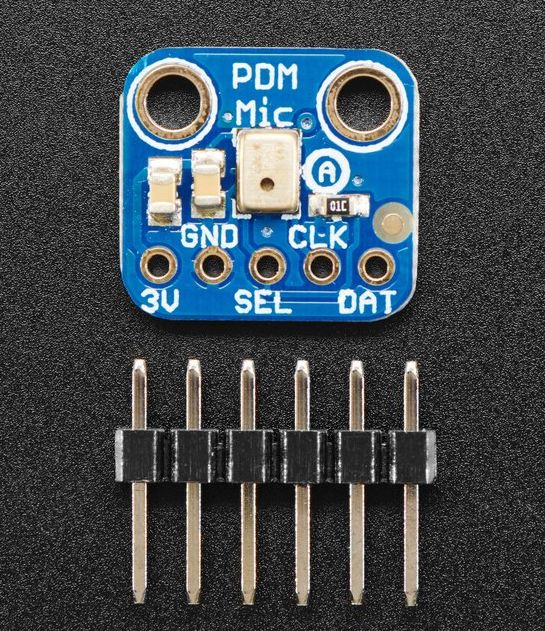
On Digikey, the cheapest PDM microphones go for around $1 a piece. Or you can buy a breakout board on Adafruit for $5. It has an ST MP34DT01-M microphone with a 61dB signal to noise ratio (SNR).
Check out my later blog post on PDM microphone specifications to better understand what this 61dB really means.
PDM Interface
One benefit of a PDM over an I2S interface is the number of IOs required: an I2S interface requires 3 (clock, word select, data) while PDM only requires 2 (clock, data).
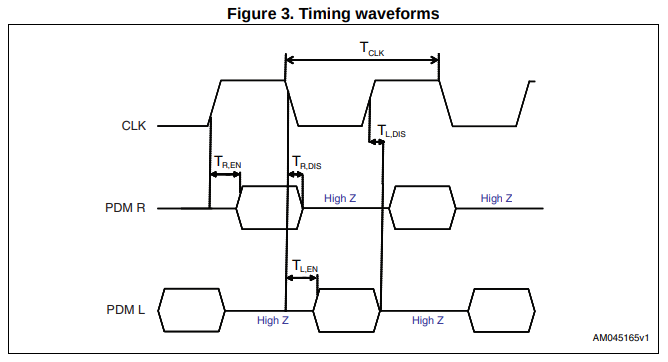
Both I2S and PDM allow 2 audio channels (left and right) to be transferred on a single data wire: a microphone is supposed to tri-state its data output when it’s the other microphone’s turn to drive that line. In the case of I2S, the microphones hands over control of the data line for every PCM sample (usually 16 bits). For PDM, control of the data line switches on every rising and falling edge of the clock.
A local configuration input tells the microphone whether it has been assigned to the left or the right channel.
Pulse Code Modulation and Quantization Noise
Humans are able to hear audio in a range from 20 to 20000Hz, though the range goes down significantly with age. Digital signal theory dictates that audio needs to be sampled at a frequency of at least twice the bandwidth to accurately reproduce the original signal. That’s why most audio is recorded at 44.1 or 48kHz sample rate.
The number of bits at which the audio signal is sampled determines how closely the sampled signal matches the real signal. The delta between sampled and real signal is the quantization noise.

In the plot above, the sine wave gets quantized to 8 discrete levels (3 bits). The obvious way to reduce the quantization noise is obviously to increase the number of bits. At 256 level (8 bits), the noise is barely visible on a linear plot:

CD-level audio uses 16 bit audio. Professional audio often uses 24 bits. (It’s not that anyone can hear the difference between 20 bits and 24 bits, but with more bits you can do a lot of audio operations on the mixing table and lose precision in the process without ending up with audible artifacts.)
It is, however, possible to trade off the number of bits for clock speed.
That’s what happens with PDM microphones: they use a very smart quantizer that converts the analog input signal to 1 bits, but with a sample clock from 1 up to 3+ MHz.
From Analog Signal to PDM with a Sigma-Delta Converter
It used to be that analog to digital converters had a resistor ladder network with comparators to convert the analog input straight into a PCM value. This is still done for very fast A/D converters, but they are very expensive to implement.
PDM microphones use so-called sigma-delta A/D converters instead. They continuously toggle between -1 and 1 to approximate the original signal, while feeding back the cumulative errors between the 1-bit output and the real input value.
sigma-delta or delta-sigma: it’s the same thing. I’ll be using the former because that’s the name that was used at a job many years ago. delta-sigma just sounds weird to me.
The ratio of the number of -1’s and 1’s, the pulse density, represents the original analog value. PDM microphones encode -1 as a logic 0 and 1 as a logic 1.
Here’s an example of a PCM 16kHz sine wave with a 48kHz sampling rate that’s converted to PDM with a first order, 16x oversampling sigma-delta converter:

At the peak of the sine wave, the green output consists of primarily ones, while at the trough, the output is primarily minus ones.
Jerry Ellsworth has great video that shows how to build a sigma-delta A/D converter yourself with just 1 flip-flop and a few capacitors and resistors.
Sigma-delta converters are complex beasts. The Wikipedia article goes into a decent amount of intuitive detail without going totally overboard on theory, but it comes down to this:
Just increasing the oversampling rate and reducing the number of output bits in an A/D converter doesn’t automatically reduce quantization noise. In fact, the noise is inevitable! However, if you can push this noise into the frequency components that are outside the frequency range of the original input signal, then it’s easy to recover the original signal later by using a low pass filter.
And that’s what happens in a sigma-delta converter.
We can see this in the power spectral density of the PDM signal above:

The bandwidth of the signal that we’ve sampled lays on the left of the green dotted line at 24kHz (1/2 of the original 48kHz sample rate.) That’s where we see the main spike: this is our sine wave. Everything else is noise.
We can also see that the bandwidth of our signal is 1/16th of the total bandwith, which is 384kHz, half of the PDM sample rate of 768kHz. With a perfect low pass filter, we could remove all the noise to the right of the green line, after which we’d end up with a SNR of 35dB.
(Note that the input signal has an amplitude of 0.5 instead of 1. That’s why the frequency of the sine wave peaks at -6dB. Increasing the amplitude would increase the SNR, but soon you run into limitations of sigma-delta converters that prevent you from using the full input range.)
Simulating Sigma-Delta Converters
Simulating sigma-delta converters and checking the results was a big help in understanding how they behave.
I used the python-deltasigma package for this. According to
its documentation, it’s a port of the Matlab Delta
Sigma Toolbox.
I don’t know enough about sigma-delta converter to judge the correctness of the results, but the graphs that I created matched closely the graphs of various MEMS datasheets. If not numerically exact, the plots that I’ve created here should at least by qualitatively correct.
One thing that bothers me in my sigma-delta plots, is the difference between the theoretical/expected and simulated frequency response: at lower frequencies, the simulated signal stays almost always below the theoretical line, but at higher frequencies, there are consistent spikes. I don’t know why this is the case.
Higher Order Sigma-Delta Converters
A SNR of 35dB is far from stellar (it’s terrible), but keep in mind that we’re using a very simple first order sigma-delta converter here. Remember how I wrote earlier that there is an error feedback mechanism that keeps track of the difference in error between output and input? Well, it turns out that you can have multiple nested error feedback mechanisms. If you have 2 feedback loops, you have a second order converter etc.
Let’s see what happens when we use higher order converters on our sine wave:

Do you notice the difference between the different orders? Neither do I! There’s no obvious way to tell apart the PDM output of a first and a 4th order sigma-delta converter.
But let’s have a look if there were any changes in the frequency domain:

Nice! Despite the constant oversampling rate of 16, the SNR increased from 35dB to 50.2dB!
Higher order sigma delta converters are significantly more complex and at some point they become difficult to keep stable. Most contemporary PDM microphones use a 4th order sigma-delta converter.
For a given oversampling rate, there’s a point where increasing the order of the converter stops increasing the SNR. For this example, that point is right around here: the maximum SNR was 51dB.
Increasing the Oversampling Rate
50dB is better than 35dB, but it’s still far away from the 96dB and up that one expects from high-end audio.
Luckily, we have a second parameter in our pocket to play with: the oversampling rate.
Until now, I’ve used an oversampling rate of 16x because it makes it easier to see the frequency range of the input signal in the frequency plot. But let’s see what happens when we increase oversampling rate of the 4th order converter from 16 to 32 to 64:

This time, the effect on the PDM is immediately obvious in the time domain.
And here’s what happens in the frequency domain:

WOW!!!
An oversampling rate of 64 and a 4th order sigma-delta converter seems to be do the trick.
And that’s exactly what today’s PDM microphones support.
Notice how the green vertical line shifts to the left as the oversampling rate increases. This is, of course, expected: we are doubling the sampling rate with each step while bandwidth of our input signal stays the same.
High Frequency Noise Level Depends on Sigma Delta Order
Higher order sigma-delta converters have a much lower noise floor in the frequency range of the sampled signal, but the noise increases much faster for higher order converters once the frequency is to the right of the green dotted line.
And since the noise power that was pushed out of the lower frequency ranges needs to go somewhere, higher order sigma-delta converters also have a higher noise level at high frequency ranges.
You can see that in the following graph:

For clarity, I only show the normalized frequency range up to 0.1 instead of 0.5.
As we saw before, on the left of the green line, the noise SNR is lower for higher order converters, but on the right side, the SNR for higher order converters is soon higher than for the lower order converters.
This is something to keep in mind when we need to design a low pass filter to remove all higher frequencies when converting back from PDM to PCM format: the low pass filter needs to be stronger for higher order sigma-delta converters.
PDM and Sigma-Delta Converters Summary
The most important things to remember about PDM microphones and their sigma-delta converters are that:
- they use oversampling to trade off bits for clock speed
- they push the quantization noise into the frequency range above the bandwidth of the sampled signal of interest.
The Road from PDM to PCM
We now know the characteristics of an PDM encoded audio signal.
What do we need to do to convert it to a traditional PCM code stream of samples?
There are 2 basic components:
-
send the PDM signal through a low pass filter
This increases the number of bits per sample back to a PCM value. It also removes all the higher order noise.
-
decimate the samples back to a lower sample rate
Coming Up
Enough learning about how to make fancy graphs with NumPy! (You can find the code for that here, BTW.)
Let’s learn how to design some real filters!
References
My Blog Posts in this Series
- An Intuitive Look at Moving Average and CIC Filters
- PDM Microphones and Sigma-Delta A/D Conversion
- Designing Generic FIR Filters with pyFDA and NumPy
- From Microphone Datasheet to Filter Design Specification
- Half-Band Filters, a Workhorse of Decimation Filters
- Design of a Multi-Stage PDM to PCM Decimation Pipeline
Sigma-Delta A/D Converters
-
How delta-sigma ADCs work, Part 1 and Part 2
Texas Instruments article. Part 1 is a pretty gentle introduction about the sigma-delta basics. Part 2 talks about filtering to go from PDM to PCM, but it’s very light on details.
-
SAR ADCs vs. Delta-Sigma ADCs: Different architectures for different application needs
TI training seminar about successive approximation ADCs vs delta-sigma ADCs. A significant portion of the video is dedicated to sigma-delta characteristics and filtering. A slide deck is also available.
-
Delta-sigma Modulation on Wikipedia
PDM Microphones
Waveform Data
-
16kHz sine wave, input sample rate 48kHz, 64x oversampling ratio, 4th order sigma-delta
For those who don’t want to install the deltasigma python package.