A Tektronix TDS 420A, a Serial Debug Console, a Symbol Table, and Ghidra
Previous installments in this series: In the Lab - Tektronix TDS 420A Oscilloscope, Tektronix TDS 420A Remote Control over GPIB, Extracting the Tektronix TDS 420A Firmware
- Introduction
- Connecting to TDS 420A RS-232 Debug Console Port
- The VxWorks Operating System
- Creating a Full Symbol Table
- Ghidra, a Binary Code Analysis Tool
- Diving Deep into the TDS 420A Firmware with Ghidra
- When You Don’t Have a Symbol Table…
- That GPIB Address 29 in Firmware Update Mode
- To Be Continued…
Introduction
With the firmware extracted, it’s now time to dig deeper by connecting to the scope’s RS-232 debug interface to a PC and see what we find.
Connecting to TDS 420A RS-232 Debug Console Port
Like most Tektronix oscilloscopes of that era, my TDS 420A has an external RS-232 port (Option 13). However, it can only be used for the HardCopy feature, where you connect the scope to an ancient printer to dump screenshots.
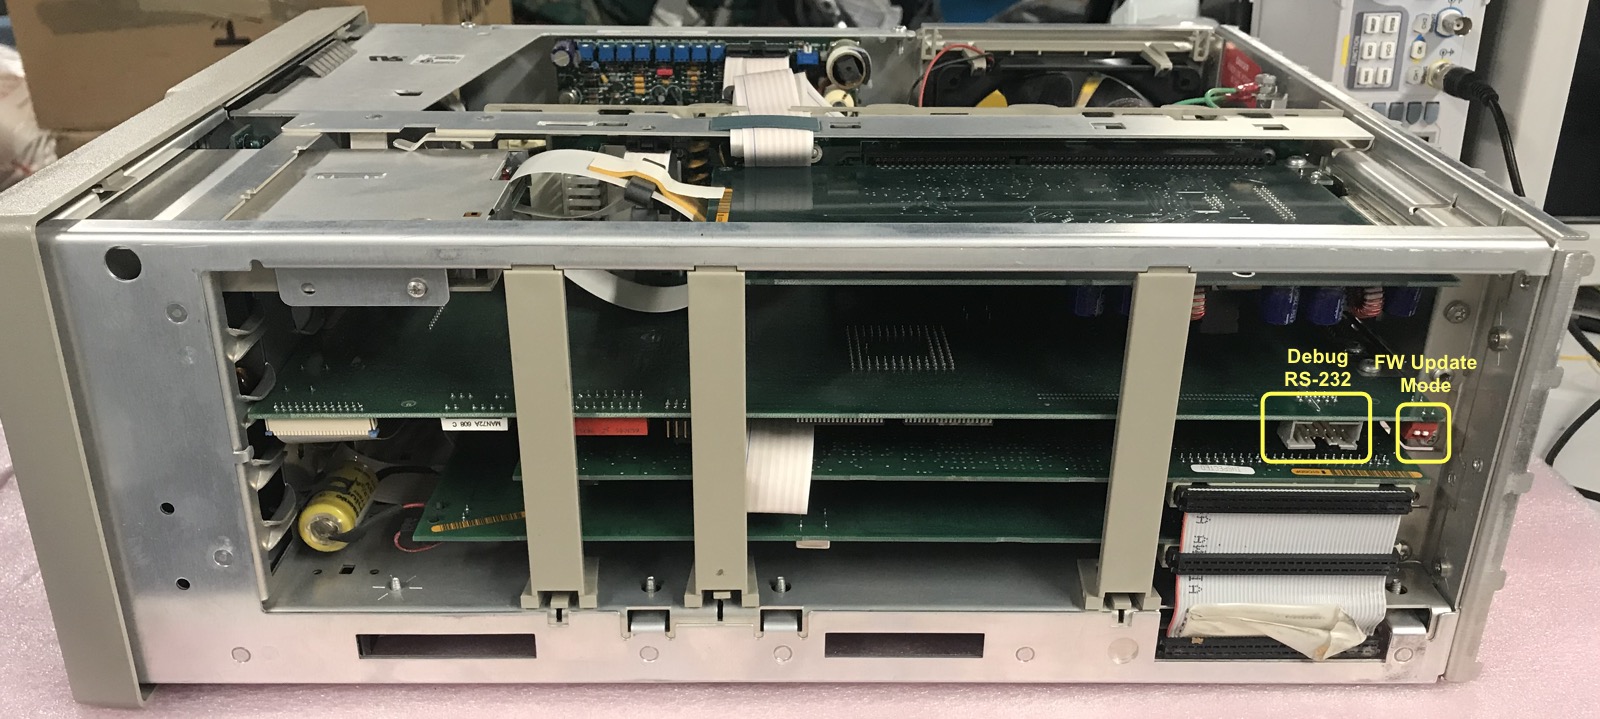
But that’s not the only RS-232 port! Next to the firmware update switches on the CPU PCB, you can find a 10-pin connector that carries the RS-232 port for the debug and diagnostic console.
To access this port, you need to remove the cover of the scope: just remove 5 torx screws and you’re good.
Important reminder: not only are there 110V circuits in the scope, there’s also a CRT that requires much higher voltages! Don’t even think about randomly touching things in there unless you know what you’re doing!!!
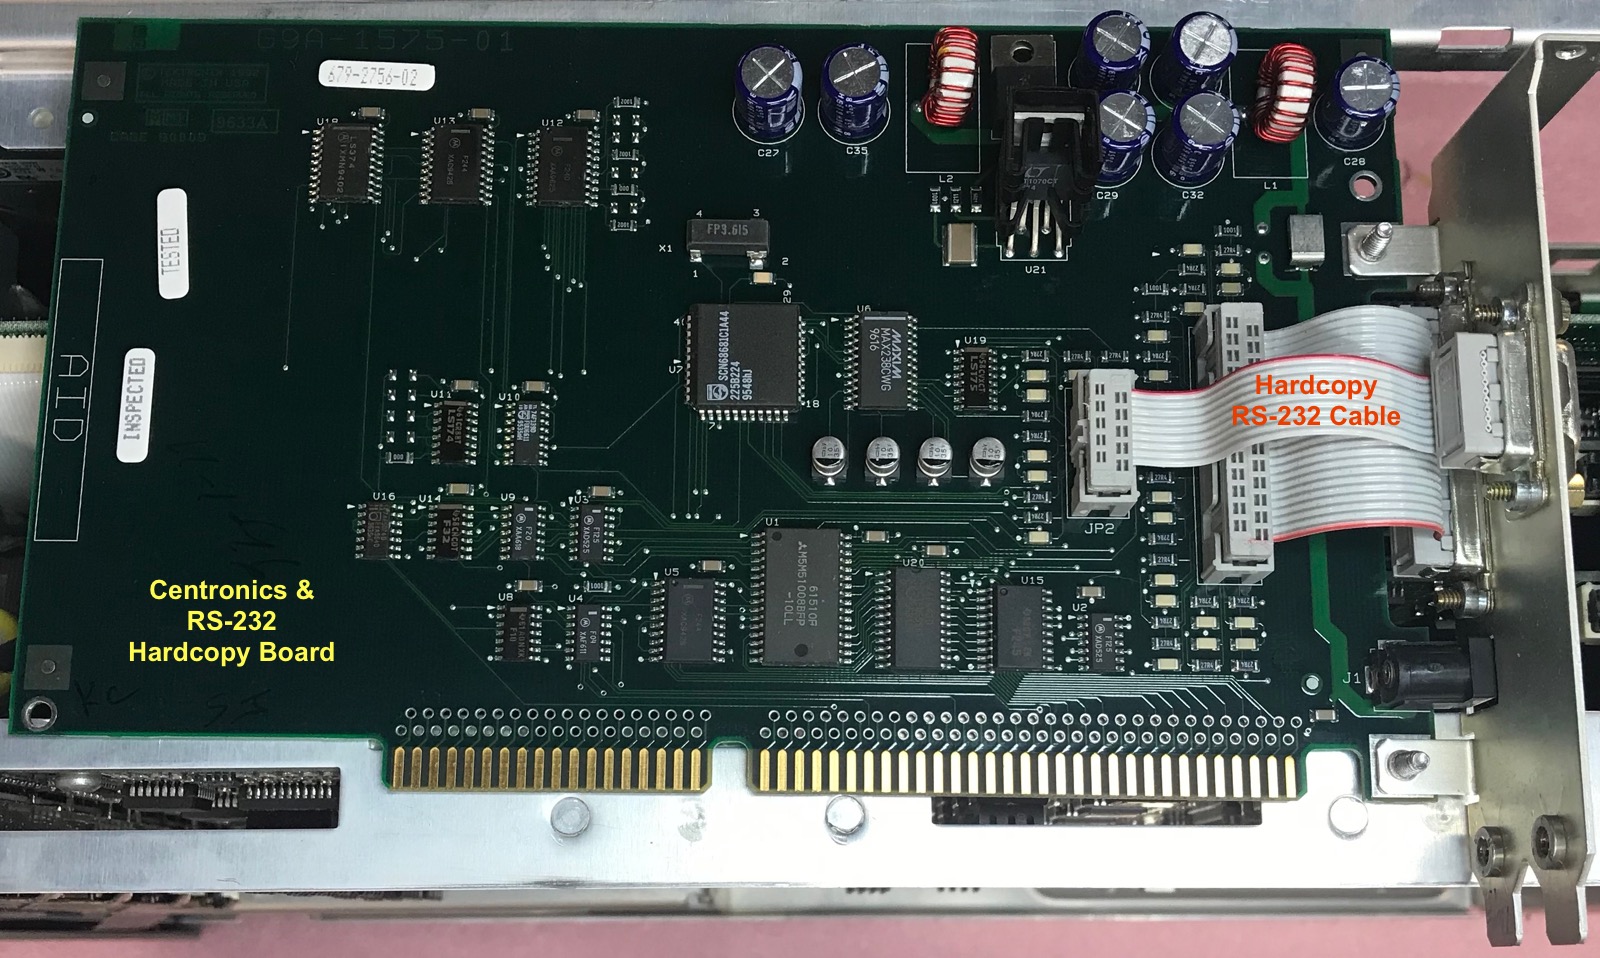
Tektronix used to sell a cable to convert the 10-pin header into a standard DB9 serial port connector, but I had a much better idea:
The external RS-232 DB9 connector of the HardCopy plug-in board also goes to a 10-pin header. If I removed the 10-pin-to-DB9-cable from that PCB, and connected it to the 10-pin header of the CPU PCB, then surely that would allow me to connect the debug port to a regular DB9 serial cable.
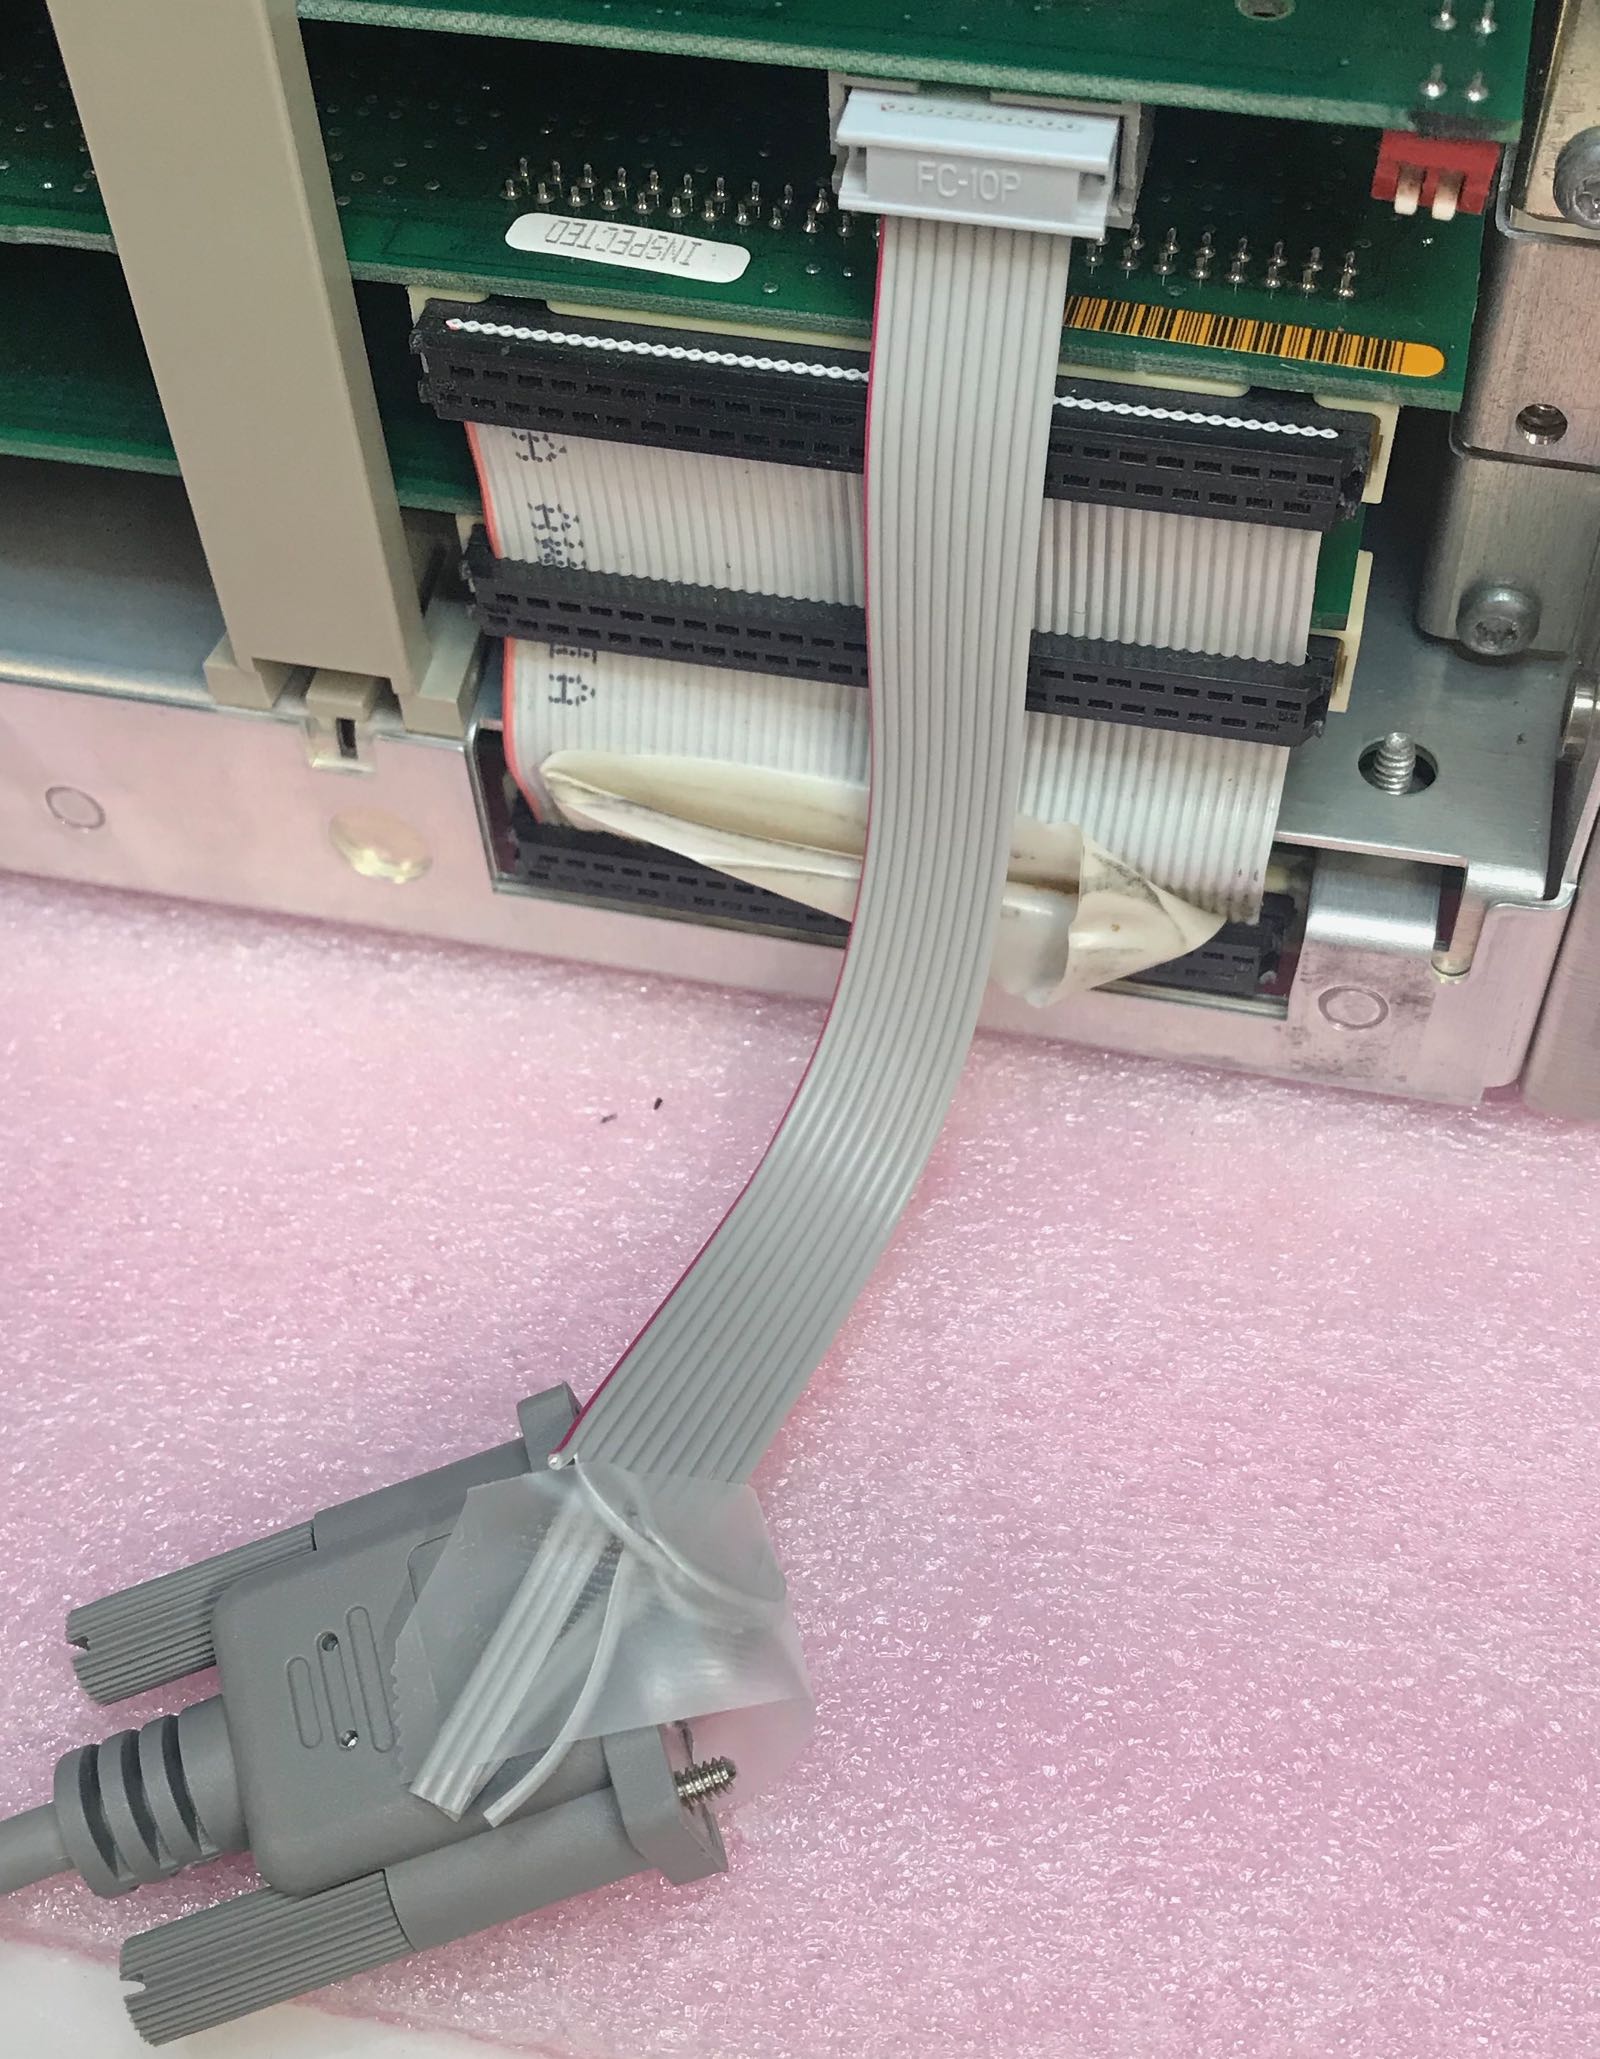
Because, surely, the Tektronix wouldn’t be so dumb to have different pinouts for the external RS-232 to DB9 cable and the internal one?
Well, I tried that, and it didn’t work, because Tektronix was indeed that dumb. The debug console cable is rotated by 180 degrees compared to the external cable.
After wasting a perfectly good half hour on this, I connected the thing up with some flimsy wires. Make sure you configure it in null modem configuration: the RX on the PC must be connected to the TX of the scope and vice versa.
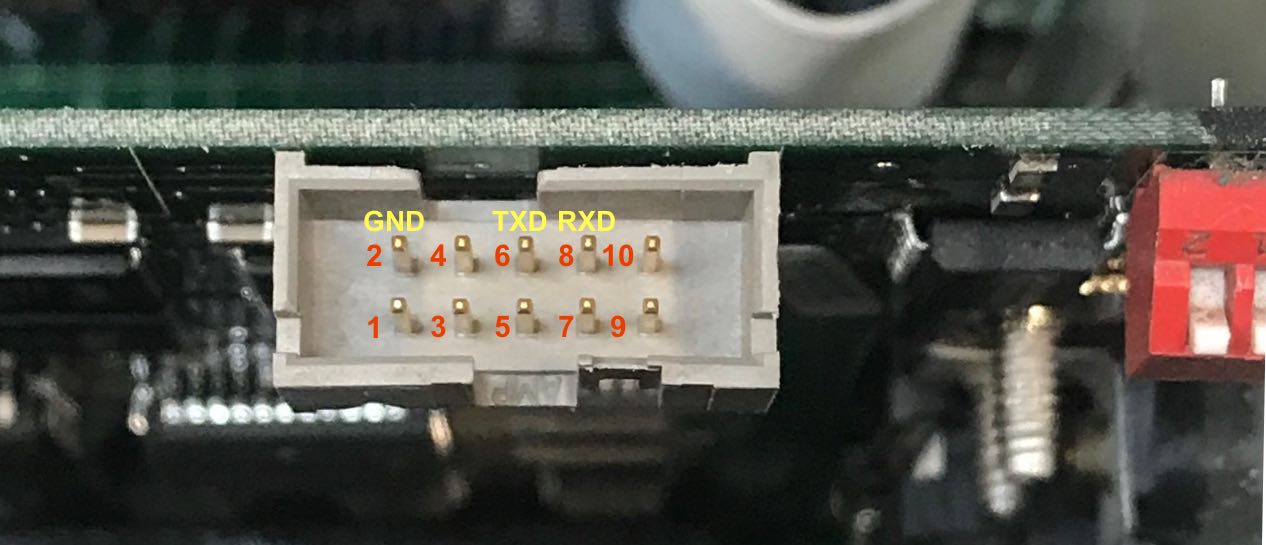
There is no need to wire up any of the RS-232 flow control pins. TXD and RXD are sufficient.
Armed with a USB to RS-232 converter, I used picocom -b 9600 /dev/ttyUSB0, and
the following characters rolled on the screen after powering up the scope:
	Bootrom Header Checksum passed.
	Bootrom Total Checksum passed.
	BootRom Check Sum passed.
	Bus Error Timeout test passed.
	Bus Error Write to Bootrom passed.
	GPIB Test passed.
Kernel Diagnostics Complete.

Calling SDM (monitor) Routine.

SDM (monitor) not enabled.
	Enabling Bus Control register. Value = 0x2
	Flashrom Programming Voltage is OFF.
	Flashrom DSACK and JumpCode test passed.
	Flashrom Checksums passed.
Bootrom Diagnostics Complete.

Transferring control to the Flashrom.
sysDramControllerInit
sysDramByteStrobeTest
sysDramTest
bcopy(<Idata>)
bzero(<bss>)
intVecBaseSet(getVbr())
sysDevDramTest
0x0 bytes of development dram found
validateDataSpace
Outer Kernel DSACK Test
Pending Interrupt Test
Walk IPL to Zero Test
Timer Int Test
usrInit()
cacheEnables()
bzero(&edata,&end - &edata)
intVecBaseSet()
excVecInit()
bzero(&end,sysMemTop() - &end )
sysHwInit()
ioGlobalStdSet({STD_IN,STD_OUT,STD_ERR})
xcInit()
logInit()
sigInit()
dbgInit()
pipeDrv()
stdioInit()
dosFsInit()
ramDrv()
floatInit()
mathSoftInit()
spyStop()
timexInit()
selectInit()
symTblCreate(standAlone)
symTblCreate(stat)
sysStarSut(a
            rtni Pcopower-On Diag Sequence
hwAccountant probe routines
  Probe for unexpected pending ints
  Real time clk present
  Dsp Instr mem size
  Dsp D2 mem size
  Dsp D1 mem size
  Dsy Vect0 mem size
  Dsy Vect1 mem size
  Dsy Wfm0 mem size
  Dsy Wfm1 mem size
  Dsy Text0 mem size
  Dsy Text1 mem size
  Acq number of digitizers
  Acq mem size
>   Cpu timer interval uSec
  Cpu Dram size
  NvRam mem size
  Opt Math Package presence
  Opt RS232/ Cent presence
  Acq 8051 presence
  Acq ADG209C presence
  Opt 1M presence
  Acq record length size
  Opt TvTrig presence
  Dsy color presence
  Opt floppy drive presence
dsyWaitClock ................... pass
clockCalVerify ................. pass
cpuDiagBatTest ................. pass
cpuDiagAllInts ................. pass
cpuEEromLibDiag ................ pass
calLibDefaultCk ................ pass
dspForcedBus ................... pass
dsp68kD2MemTest ................ pass
optRS232DuartIO ................ pass
dsp68kMemTest .................. pass
dspRunVerify ................... pass
dspBusRequestTest .............. pass
dspImplicitBusAccess ........... pass
dspTristarMemTest .............. pass
dspDsyToDspInts ................ pass
dspAcqToDspInts ................ pass
nvLibrariansDiag ............... pass
dsyDiagResetReg ................ UNTESTED
atBusTest ...................... pass
dsyDiagResetReg ................ UNTESTED
dsyDiagVscReg .................. pass
dsyDiagPPRegMem ................ pass
dsyDiagRasRegMem ............... pass
dsyDiagRegSelect ............... pass
dsyDiagRamdacRegMem ............ pass
dsyDiagAllMem .................. pass
dsySeqYTModeV0Intens ........... pass
dsyDiagSeqXYModeV1 ............. pass
dsyRastModeV0Walk .............. pass
dsyRastModeV1Attrib ............ pass
dsyWaitClock ................... pass
attn8051testResult ............. pass
attnDACReadback ................ pass
dsyWaitClock ................... pass
acq8051testResult .............. pass
adgRegDiag ..................... pass
dsyWaitClock ................... pass
adgMemTestDiag ................. pass
trigComparatorTest ............. pass
trigDBERunsAfter ............... pass
tbiRampTest .................... pass
acqRampDiagAll ................. pass
dsyWaitClock ................... pass
fpDiagConf ..................... pass
et not started, either there was trouble or the devnet is missing
floppyDriverStartup()
can't open input 'fd0:/startup.bat'
  errno = 0x13 (S_errno_ENODEV)

/Thu May 9 11:26:15 PDT 1996/k2_vu/paulkr

Smalltalk/V Sun Version 1.12
Copyright (C) 1990 Object Technology International Inc.
0x2ff4684 (V main):
brTriesMax:         1 busRequestCount: 1 busRequestGranted: 0
I was in business!!!
The VxWorks Operating System
In my previous blog post, I already came across the VxWorks logo in the main firmware dump.
VxWorks is a popular real-time operating system (RTOS) for embedded systems with real-time constraints. An oscilloscope is a very good example of that.
It supports a large amount of CPUs (the TDS 420A has a Motorola 68020), has a preemptive multitasking kernel, file systems, network protocol stacks etc. The OS can run a large number of different tasks with different priority.
One of those tasks is the console command shell, which allows us to enter commands, get status information, start, suspend, and kill tasks etc.
Typing the i command lists all the tasks that are running the scope, sorted by
priority.
-> i

  NAME        ENTRY       TID    PRI   STATUS      PC       SP     ERRNO  DELAY
---------- ------------ -------- --- ---------- -------- -------- ------- -----
tExcTask   _excTask      2ffc1d0   0 PEND        11db492  2ffc130       0     0
tLogTask   _logTask      2ffac88   0 PEND        11db492  2ffabe4       0     0
tShell     _shell        2ff8f54   1 READY       11c6c54  2ff8c00       0     0
gpibIHTask _gpibIHTask   2fed2a0   4 PEND        11db492  2fed218       0     0
fifoTask   _fifoTask     2fed9d4   9 PEND        11c8330  2fed988       0     0
causeEnable_causeEnable  2fffcdc  10 READY       11db492  2fffc4c       0     0
rtcTicker  _dateTimeQue  2feed08  51 DELAY       11cdf50  2feecc0       0    21
priority_no_priority_no  2ff0758  60 PEND        11c8330  2ff0714  3d0001     0
grun Reboot_rebootGrun   2fe8d0c  65 PEND        11c8330  2fe8cc4       0     0
GPIB monito_GpibMonitor  2fec970  68 PEND        11c8330  2fec914       0     0
GPIB reboot115c804       2fec060  68 PEND        11c8330  2fec01c       0     0
trigStatus _trigStatusQ  2ffecd8  69 DELAY       11cdf50  2ffec9c       0    13
GPIB parser_Grun         2feb750  70 PEND        11c8330  2feb3d8  3d0001     0
serialPrint_spTask       2fef424  71 PEND        11db492  2fef340       0     0
V main     _main         2ff4684 100 PEND        11c8330  2ff45f4  3d0002     0
evalProcess_eval_loop    2ff1e14 120 PEND        11c8330  2ff1dd4  3d0002     0
centronicsT_centronicsT  2fff40c 128 PEND        11c8330  2fff3bc       0     0
libSaver   _realLibSave  2ff4e48 250 DELAY       11cdf50  2ff4df4       0    21
sysIdle    _sysIdle      2ffd790 255 READY       11c6292  2ffd754       0     0
value = 57 = 0x39 = '9'
help is a good starting point to see what you can do from the shell, but
it only scratches the surface about what’s possible. That’s because console shell
allows calling any function that is declared in the symbol table as if it’s a native
console command.
You have no idea how useful that is if you want to inspect the internals of a system:
all the functions that
I found through the strings main_fw.bin command
can be called and executed in a live working environment!
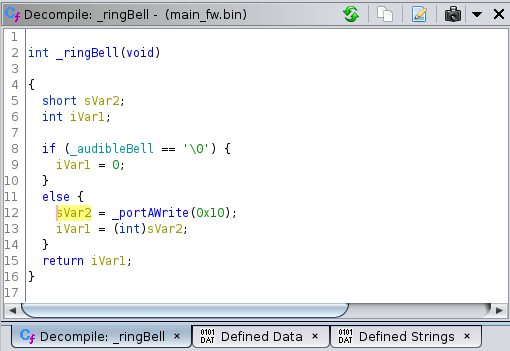
Here’s a simple example: there is ringBell() function in the firmware. When I type ringBell
on the console… the bell rings.
VxWorks in combination with a shell and a symbol table is a massive firmware reverse engineering cheat code.
Creating a Full Symbol Table
The most useful function of all is lkup: it checks if a given string matches any part
of the strings in the symbol table, and prints out these matching symbols with their corresponding
address.
For example, lkup "_a" give the following list:
_atBusAddrTest  0x0117dba8 text
_activateElement 0x0119b820 text
_attnDecadeDivCh1 0x0115464e text
_acquiredWfms   0x02e98380 bss
_auxDescBuf     0x02e55af0 bss
_set_if_addr    0x011f1032 text
_attnSigPathCh4 0x011543d4 text
_arpinput       0x011eff26 text
_asctime        0x0119adba text
_m_adj          0x011f57e8 text
_adgMemShortDiag 0x01185528 text
_atBusTest      0x0117ddd0 text
_attnSigPathCh1 0x01154344 text
_aliasNameBufList 0x02e56450 bss
_asciiPoint     0x02e577c0 bss
...
_xdr_attrstat   0x011e5750 text
...
Note how the list includes _xdr_attrstat because it has _a in the middle of the string.
With lkup, I could dump all the symbols in the binary to create a symbol table that can
be used in binary code analysis tools such as Ghidra or
IDA Pro.
Instead of dumping them all at once, I went from _a to _z and from _A to _Z. The end
result were 5000+ symbols and their address.
Ghidra, a Binary Code Analysis Tool
Ghidra is an open source binary code analysis tool that was released about 1 year ago by the NSA, believe it or not. IDA Pro and IDA Home are the commercial (expensive!) equivalent of Ghidra.
A binary code analysis tool is essentially a smart disassembler that takes in a pure binary dump, identifies machine code segments and data such as strings and pointers, converts them to low level C code, cross references calls from one function to the other, creates call graphs etc.
Even without a symbol table, tools like this can go a long way in uncovering the secrets of firmware, but add one to the mix, and major parts of the the firmware become an open book.
Diving Deep into the TDS 420A Firmware with Ghidra
I have never used a binary code analysis tool before, but I had heard great things about Ghidra and I was eager to give it a try. Ghidra has support for a large number of CPUs, even ancient ones like the 68020.
Long story short: Ghidra is amazing. In 15 minutes, I went from downloading the tool to browsing through the TDS 420A firmware, jumping in and out of layers of function calls and being productive with it.
Just follow these steps:
- Start the tool with
ghidraRun - Create a new project
- File -> Import File ->
main_fw.bin-> Select File To Import - Language -> 68000 / MC68020 Variant
- Option -> Base Address -> 0x01000000
- Ok
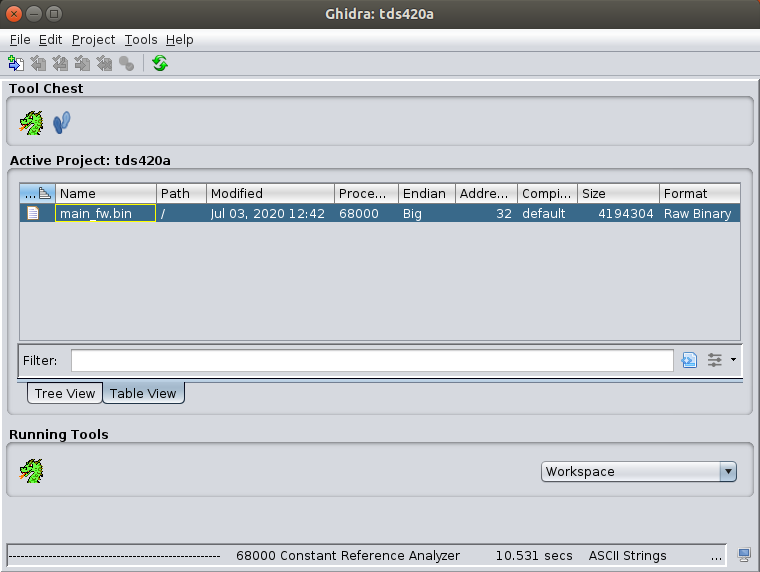
After double clicking main_fw.bin, you’ll be asked if the newly imported binary should
analyzed. Of course, it should! After waiting half a minute, you’ll be greeted with
thousands of anonymous C functions in the Symbol Tree window.
I could now load the symbol table that I created earlier, which replaced many of these unnamed functions by named ones. Here’s how you go about importing this table into Ghidra:
- Window -> Script Manager
- Select ‘Data’ in the Scripts list
- Double click on ‘ImportSymbolsScript.py’
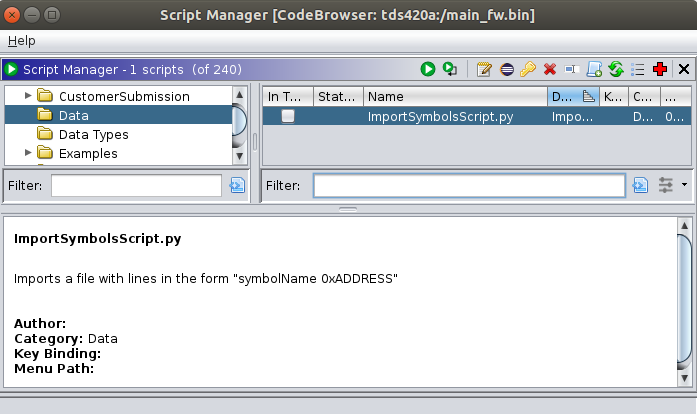
Now select the symbol table file, and 5000+ of functions that were previously anonymous will suddenly reveal their name.
The ringBell function that I executed earlier on the debug console gets decompiled
to this:
There are plenty of Ghidra tutorials on the web, but I have yet to read one of them. A few tactical Google searches were needed to discover the way to set the firmware based address to 0x01000000, or to figure out now to import the symbol table, but other than that Ghidra UI is intuitive enough to get many things done by just trying things out.
That said, it’s certain that I haven’t even scratched the surface of what’s possible!
When You Don’t Have a Symbol Table…
Based on all of the above, one might think that a symbol table is necessary to get useful information out of a binary executable. Nothing could be further from the truth.
I did the Ghidra exercise on the boot ROM, and the result were still impressive: it’s a bit more of puzzle where one discovery will lead to the next.
The most important breadcrumbs are embedded strings.
When the scope is in firmware update mode, the RS-232 debug console is output-only. Here’s the full log after booting up:
	Bootrom Header Checksum passed.
	Bootrom Total Checksum passed.
	BootRom Check Sum passed.
	Bus Error Timeout test passed.
	Bus Error Write to Bootrom passed.
	GPIB Test passed.
Kernel Diagnostics Complete.

Calling SDM (monitor) Routine.

SDM (monitor) not enabled.
	Enabling Bus Control register. Value = 0x2
+12V applied to Flashroms

Flashrom Programming Voltage is ON.
Cannot transfer control to Flashrom.
Transferring control to the SDM (monitor).
After importing the boot ROM binary into Ghidra, there were many bytes sequences that are obviously executable code, but Ghidra didn’t identify them as such.
I manually started telling Ghidra to disassemble these byte sequences (“Disassemble”) and convert them into functions.
Eventually I hit the jackpot, with a function that reverse compiled into the following C code:
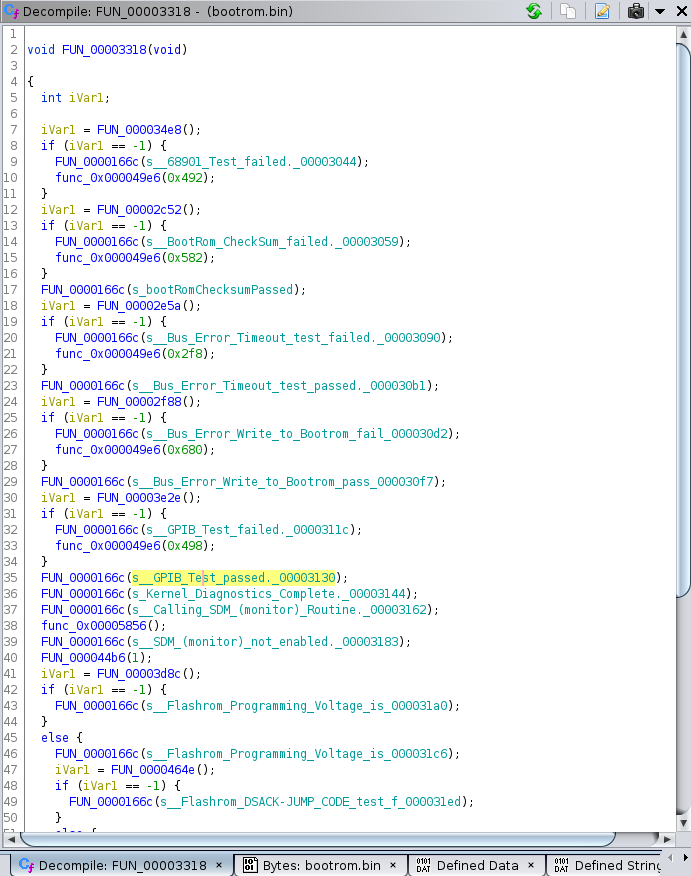
There is so much to learn from this!
FUN_0000166Cis obviously aprintfunction.FUN_000034e8must be running a 68901 test.FUN_00002c52must be doing a boot ROM checksum
and so forth.
You just rename the functions into something that’s human readable, and dive in in search for more.
This is the same code as above, but with the functions renamed. Looks much better!
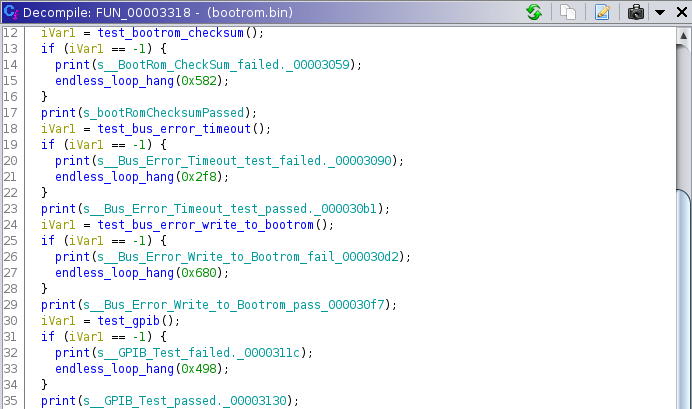
How could we use this for our scope?
A good example is the test_bootrom_checksum() function: it only takes a little
bit of effort to figure our the checksum algorithm (it’s a sum), locate where
the expected value is read from, and the address range over which the checksum is
calculated.
Once you know that, you could patch the boot ROM, or the main firmware, any way
you want, calculate the correct firmware, and flash it into the scope using
tektool.
That GPIB Address 29 in Firmware Update Mode
For fun, I wanted to see if I could find the place where the boot ROM sets a GPIB address of 29 when it’s in firmware update mode.
Here’s how that went:
- earlier, I had identified the
test_gpib()function -
test_gpib()has a number of accesses to memory location 0x7000x: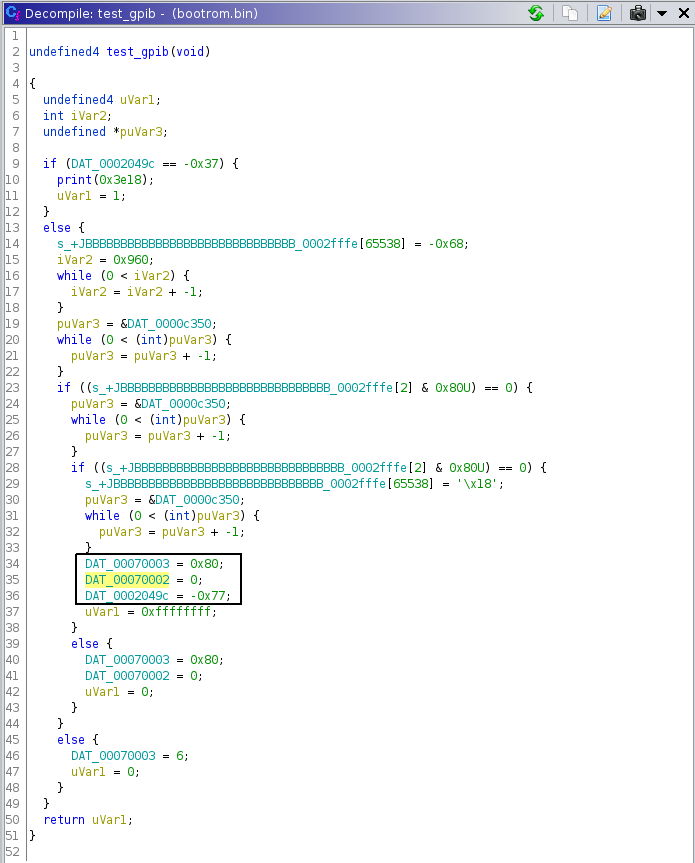
These are almost certainly writes to the register space of some GPIB protocol chip.
-
When you double click on one of these registers, you get a list with all other functions that perform read or write accesses to them
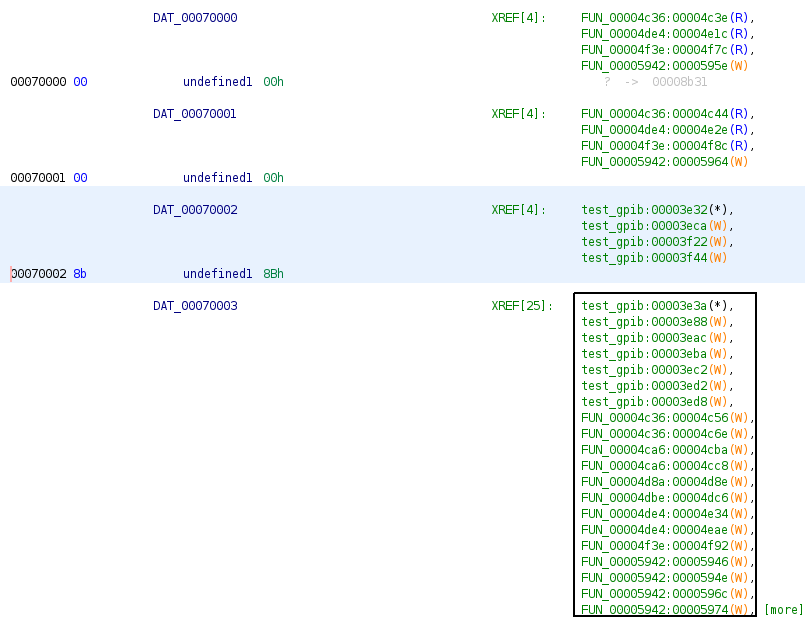
-
All you have to do now is go through all these unknown functions one by one until you find what you’re looking for:
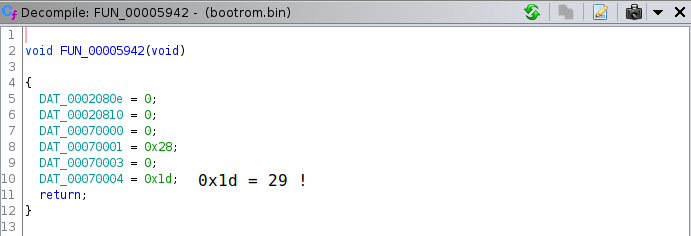
Bingo!
We’ve just identified the
gpib_init()function!
To Be Continued…
Coming up: unlocking optional features!