GDBWave - A Post-Simulation Waveform-Based RISC-V GDB Debugging Server
- Introduction
- What is a GDB Server, and how to create one?
- GDBWave in a Nutshell
- The FST Waveform Format
- GDBWave Internals - Flowchart
- GDBWave Internals - Waveform Data Extraction
- GDBWave Internals - Being a GDB server
- Running GDBWave on an example VexRiscv design with Icarus Verilog
- A Major Unresolved Issue
- Potential Improvements
- GDBWave’s Future?
- References
- Footnotes
Introduction
A small soft core CPU is a great way to add control and management operations to an FPGA design. It’s much faster to iterate through different versions of some C code without changing RTL, and not needing to resynthesize can be a big time saver too (if you know how to update RAM contents efficiently.) That’s why almost all my hobby FPGA projects have a VexRiscv RISC-V CPU.
I recently wrote about how to connect GDB to a VexRiscv CPU that’s running on the actual hardware by adding a JTAG interface. You can do something similar in simuation, by connecting GDB to OpenOCD which talks to the simulation over a faked JTAG interface. This blog post is not about that.
Instead, I want to talk about first simulating an RTL design that contains of soft CPU, and debugging the firmware that ran on that soft CPU after the simulation has completed.
I usually don’t have a JTAG interface in my designs: I’m often just too lazy to wire up a USB JTAG dongle to the FPGA board. But what I do all the time is to look at simulation waveforms and try to figure out what the CPU was doing at a particular point in the simulation. Or the other way around, I try to figure out what the hardware was doing when the CPU was executing a particular line of code.
My traditional workflow has been a follows:
- look at a waveform file
- find the region of interest
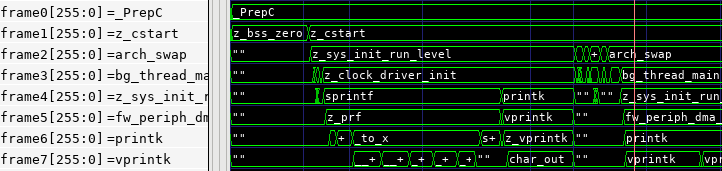
- read the program counter (PC) of the VexRiscv CPU from the waveform
- look up that program counter in a disassembled version of my C code
It’s a tedious process and it’s near impossible to get a bigger view of what’s going on in the CPU because there’s no easy way to dump the contents of the program call stack, variables, registers etc.
I was wondering how others handled this kind of debugging and fired off the following Tweet:
Question: you are simulating a RISC-V CPU that is running a C program. You are recording a VCD (or FST) trace. How do you correlate between the instruction address in the waveform and the line of C code?
— Tom Verbeure (@tom_verbeure) November 3, 2021
There were a number useful suggestions:
- Use
addr2line, part of the GCC toolchain, orllvm-symbolizerto translate the PC value straight to the C source code file and line number. - Expand the previous method by creating a GTKWave translate filter so that the file and line numbers are shown as an ASCII-encoded waveform in the waveform viewer itself.
- Matthew Balance suggested a brilliant way to
view the call stack in the waveform viewer:
- Somebody pointed out that Quartus’ SignalTap has the option to show the active assembler instruction of a Nios II soft CPU in the waveform. This would definitely have been useful back when I was using Nios CPUs. It’s also something that can be done for RISC-V CPUs with a translate filter, but it’s not exactly what I was looking for.
- @whitequark suggested adding a GDB server to a CXXRTL simulation environment. This is a variant of connecting GDB to a live simulation through a simulated JTAG interface, but it still requires an interactive simulation session.
That last suggestion gave me the idea to feed the waveform data into a GDB server:
Yes. But the end result of that is the same as using OpenOCD and jtag_vpi, right? How about a GDB server that reads in a VCD file?
— Tom Verbeure (@tom_verbeure) November 3, 2021
This was considered a cursed idea, a high mark of approval indeed!
Two months and a good amount of Christmas vacation hours later, the result is GDBWave: a post-simulation waveform-based RISC-V GDB debugging server.
What is a GDB Server, and how to create one?
In my VexRiscv, OpenOCD, and Traps blog post, I showed all the steps between a debugger IDE and an actual CPU. Let’s just say that for GDBWave the picture is less complicated:

In a remote debug environment, GDB uses the GDB Remote Serial Protocol (RSP) to talk to an external entity that is linked to the device under test. This external entity can come in two forms:
-
A GDB remote stub (or GDB stub) is a piece of debug code that is linked to the program that is under debug. The stub code is usually called when there’s some kind of debug exception, an interrupt, or a trap, at which point it takes over and starts communication with GDB.
This is a common way to debug embedded systems that don’t have an operating system and that don’t have the ability to use hardware in-circuit debugging features of the CPU. (E.g. because the JTAG port of the CPU isn’t available on the PCB.)
-
A GDB server is a separate program that is not linked to be part of the program that must be debugged. It can be an intermediate program like OpenOCD that converts RSP commands to JTAG commands to control the hardware in-circuit debugging logic of the CPU, or it could be a separate process that uses operating system features on the target machine to debug another program. A good example of the latter is the ptrace functionality in Unix-type operating systems. On these systems, the system native GDB often comes standard with a
gdbserver, which allows you to debug your Unix program remotely.
From the point of view of the GDB client, a GDB stub and a GDB server behave identical: they receive high-level RSP requests such as “step”, “continue”, “read CPU registers”, “write to memory”, or “set breakpoint”, adapt these requests to the environment in which the CPU is operating, and return requested data, if any.
If you want to make GDB believe that your recorded CPU simulation waveform is an actually running CPU under debug, you need write your own GDB server:
- Create a socket and accept incoming connections.1
- Parse the RSP protocol compliant requests from the client.
- Fetch the requested data from the recorded trace.
- Transform the data into an RSP conforming reply packet.
- Send the reply back over the socket.
There is quite a bit of generic boilerplate in there, and there are tons of open source GDB stubs that you can modify to your taste.2 I list some of them in the references below.
GDBWave is written in C++ for a two of reasons: the FST library, written in C, doesn’t have any bindings to popular scripting languages, and I also just wanted to get a taste of some of the new C++ features that have been added to language since I last used it, more than 15 years ago…
I settled on mborgerson/gdbstub, a lightweight implementation that’s designed to make it easy to support your own CPU architecture. It’s so minimal that it doesn’t even support breakpoints, but those were easy to add.
GDBWave in a Nutshell
The overall flow to use GDBWave is pretty straightforward:

- Simulate a design that contains an embedded soft core RISC-V CPU such as the VexRiscv.
- During the simulation, dump signals of the design to a waveform file.
- Tell GDBWave which signals in the design can be used to extract the processor state: the CPU program counter, and, optionally, the contents of the CPU register file, and the transactions to memory.
- Launch GDBWave as a GDB server that pretends to be a real running CPU system with debug capabilities.
- Launch the standard RISC-V GDB debugger and connect to the GDBWave debug target
- Issue GDB commands as if you are dealing with a real CPU: breakpoints, watchpoints, line stepping through the code, inspecting variables, you name it. You can even go back in time if you like.
A super nice bonus feature would be link GDBWave to your GTKWave waveform viewer so that when your GDBWave CPU hits a breakpoint, GTKWave automatically jumps to that point in time in the waveform viewer. However, there are no obvious ways to control GTKWave by an external program.
Note that all of this is possible without enabling any hardware debugging features in the simulated CPU: you can do this on a picorv32 or the award winning bit-serial SERV RISC-V CPU and it will still work. The only minimum requirement is that you can find the right signals in the RTL and in the waveform file to extract the program counter of instructions that have been successfully executed and retired.3
There are some things that GDBWave won’t allow you to do:
- You can’t change the flow of the program that’s under debug. This is an obvious first principles consequence of running a debugger on data from a simulation that has already finished.
- GDBWave currently only works with CPUs that have a single instruction, in-order execution pipeline. It’s not difficult to extend GDBWave support to more complex CPU architectures, but that’s outside the scope of this Christmas holiday project.
This blog post talks about processor traces that are extracted from simulation waveforms, but you can also gather this data from real hardware if the CPU system in your design has instruction tracing capabilities such as those described in the RISC-V Processor Trace specification.
The FST Waveform Format
In the hobby world, almost everybody dumps simulation waveforms as VCD files, a format standardized in the Verilog specification that is supported by nearly all simulation and digital design debugging tools in existence. GDBWave, however, doesn’t support VCD directly.
There’s a good reason for that: being universally supported is about the only good characteristic of what is otherwise a terrible waveform format.
- VCD is disk space hog with little or no compression.
- It requires you to read in the full file even if you want to extract the values of a signal out of thousands or more signals.
- You also can’t extract values for a give time range without first processing the values of all time steps before that.
When you work for a company that can afford it, you’re probably using Synopsys Verdi to debug digital designs. Verdi comes with the FSDB waveform format which has none of the VCD disadvantages. Unfortunately, that format is proprietary and, to my knowledge, hasn’t been reverse engineered. If you want to write tools that extract data from FSDB files, you need to link a precompiled binary library that comes with the Verdi installation.
Luckily, there’s an open source alternative: the FST format was developed by Tony Bybell, the author of GTKWave. It fixes all the flaws of the VCD format. There is no formal specification of the FST file format, but “Implementation of an Efficient Method for Digital Waveform Compression”, a paper that is included in the GTKWave manual, goes a long way to describe the design goals and how they were achieved:
-
Small file size
In my example designs, FST files are roughly 50x smaller than equivalent VCD files.
This is because it uses a two-stage compression scheme: in the first stage, it encodes signal value changes as delta values. During an optional second stage, the output of the first stage is compressed by the standard LZ4 or GZIP method.
-
FST files are saved in multiple chunks
If you need to access data somewhere in the middle of a large simulation, it will only read in the chunks that contain the desired data, and skip whatever came before.
-
Fast compression and decompression speed
Compression speed is very fast and slows the simulation down by only a small amount compared to dumping a VCD file. The FST library comes even with multi-threading support. For very large designs that dump a lot of data, multiple chunks can compressed in parallel on different CPU cores. (Note that this is a bit slower on smaller cases. It’s only helpful when you’re dumping hundreds of thousand of signals and more.)
-
Fast opening of FST files
You don’t need to process the whole file before you can extract data from it.
-
FST files can be read while the database is still being written
This is really useful if you are running a very long running simulation and you want to quickly check if everything is still behaving as planned.
This feature is direct consequence of data being written out in separate chunks.
The FST format isn’t perfect:
-
No formal format specification
There is no formal format specification, and, based on a discussion on the GTKWave GitHub project, one shouldn’t expect there to ever be one. Other documentation only exists in the form of comments in the source code, or comments by the author on other GitHub issues.
-
No FST library API documentation
There is a library to read and write FST files, but there’s no documentation on how to use it. You’re expected to figure out how things work by checking out existing utilities that read and write FST files.
In practice, it wasn’t too hard. I created
FstProcess, a C++ class that has the limited functionality that I need to extract data from an FST file. -
No stand-alone FST library
There’s no stand-alone FST library with individual version tracking etc. You’re supposed to extract the code from the GTKWave source tree.
Since the relevant code already lives in its own directory, extracting the code is easy. But the lack of versions makes it impossible to keep track of which bug fixes been applied.
-
No support for vectors with an LSB that is different than 0
Inexplicably, FST doesn’t support vector signals that don’t start with bit 0: a vector that is defined in RTL as
MySignal[31:2]gets saved asMySignal[29:0]. This is not an issue for the vast majority of designs, but considering that it would take just 1 additional parameter in the signal declaration, this omission annoys me way more that it should.
Still, the benefits of using the FST format far outweigh the disadvantages, especially if you’re dealing with huge waveform databases.
Verilator and Icarus Verilog support FST out of the box. GTKWave does too, of course.
If your simulation tool can’t generate FST files, you can always use the vcd2fst conversion utility
that comes standard with GTKWave.
If you’re using the FST format as part of a Verilator testbench, make sure to NOT call the
flush() method on the VerilatedFstC trace object after each simulation cycle. I did this in one of
my testbenches and
my simulation speed dropped by a factor of 20
compared to using VCD!
GDBWave Internals - Flowchart
This following sections goes into some of the implementation aspects of GDBWave. Some of this is for my own use so that I don’t forget why things were done a certain way. You can safely skip this if all you’re interested in is using GDBWave for your own projects.
Internally GDBWave is pretty straightforward. This is the simplified flow chart:

GDBWave Internals - Waveform Data Extraction
As mentioned earlier, I created FstProcess,
a thin C++ wrapper around the native GTKWave fstapi.h library.
Program Counter Extraction
At the very minimum, GDBWave needs to know which instructions have been successfully executed by the CPU. It does so by tracking the program counter.
In the case of the VexRiscv, I use 2 signals that are present in all VexRiscv configurations:
lastStagePc[31:0]lastStageIsValid
When lastStageIsValid is asserted, lastStagePc contains the program counter value of an instruction that has
completed execution. Perfect!
The code to extract the program counter is very simple.
First, I save the most up-to-date value of these 2 signals as I march through the waveform database:
    if (signal->handle == cpuTrace->pcValid.handle){
        cpuTrace->curPcValidVal   = valueInt;
        return;
    }

    if (signal->handle == cpuTrace->pc.handle){
        cpuTrace->curPcVal    = valueInt;
        return;
    }
Second, when I see a falling edge of the clock,
I record the program counter if the valid signal is asserted.
All program counter values are stored in a vector array, along with the time stamp at which they changed.
    if (signal->handle == cpuTrace->clk.handle && valueInt == 0){
        if (cpuTrace->curPcValidVal){
            PcValue     pc = { time, cpuTrace->curPcVal };
            cpuTrace->pcTrace.push_back(pc);
        }
    }
Why the falling edge of the clock? Because in a clean, synchronous design, all regular signals change at the rising edge of the clock and you can be certain that all signals will be stationary at the falling edge. You don’t have to worry about whether or not the clock was rising immediately before or after a functional signal changed. It just makes things less error prone.
Extracting Register File Writes
Knowledge of CPU register file contents is essential if you want to track the value of local variables
that are never stored to memory. For example, chances are very high that the counter variable of a tight for
loop only ever lives in a CPU register.
To know the state of the register file, it’s sufficient to record only the writes to it, as long as you know the initial state of the full register file at the start of the simulation. But even not knowing the initial state is usually not a big deal, because most CPU startup code will initialize its registers by writing an appropriate value.
For a VexRiscv CPU, the signals to observe are:
lastStageRegFileWrite_validlastStageRegFileWrite_payload_addresslastStageRegFileWrite_payload_data
The code to extract register file writes from the FST waveform is as straightforward as the one to extract program counter changes.
Extracting CPU Memory Writes
Finally, there’s the knowledge of the RAM contents on which the CPU operates. GDB issues memory reads for a couple of reasons: to know the value of variables that are stored in RAM, to inspect the call stack of a running program, and to disassemble the code that it is debugging.
Memory contents can also be derived from the writes to memory, but, contrary to the register file, it’s really important to know the initial state of the RAM as well. That’s because the FPGA RAM that’s used to store the CPU instructions is usually preloaded after powering up and never written.
For the VexRiscv, write operations can be extracted by observing the following signals:
dBus_cmd_validdBus_cmd_readydBus_cmd_payload_addressdBus_cmd_payload_sizedBus_cmd_payload_wrdBus_cmd_payload_data
The code to extract the write operations can be found here.
To get the initial state of the RAM, my firmware Makefile
creates a binary file
with the contents of the RAM:
progmem.bin: progmem.elf
	$(OBJCOPY) -O binary $< $@
This file is
read directly by the MemTrace object4:
    if (!memInitFilename.empty()){
        printf("Loading mem init file: %s\n", memInitFilename.c_str());
        ifstream initFile(memInitFilename, ios::in | ios::binary);
        memInitContents = vector<char>((std::istreambuf_iterator<char>(initFile)), std::istreambuf_iterator<char>());
    }
In the future, I might extend GDBWave to read ELF files directly, but the current method works well enough for me.
Note that it’s also possible to figure out the contents of the program RAM iteratively by observing read transactions on the CPU instruction fetch bus. The only problem is that you can’t disassemble sections that have never been executed by the CPU. In practice, I don’t think this would be a major issue: looking at the low level assembly code in GDB isn’t something I do very often, especially for code that never gets executed. Still, most of the time you’ll have access to the binary file of a program that you’re trying to debug, so I didn’t go through the trouble, yet, to look at the instruction read transactions…
GDBWave Internals - Being a GDB server
Once all the necessary data has been extacted, GDBWave can act like GDB server.
As soon as a TCP/IP connection with the GDB client has been established, the server sends a RSP signal packet to inform the client about the current execution state of the CPU. In GDBWave, that execution state is HALT. After that, GDBWave enters an endless loop where it waits for RSP commands, and executes them as they arrive.
Many RSP commands are optional and not implemented. GDBWave only implements:
-
sto execute/step a single assembler instruction on the CPUIn a GDB client, the “step” command moves to the next C instruction. In the RSP protocol, it executes just 1 assembler instruction.
Executing an instruction in GDBWave is a matter of moving the index in the program trace forward by 1, updating the state of the register file, and sending a TRAP signal packet to GDB.
After receiving this trap, the GDB client always queries the contents of the register file, so it makes sense to already get this data ready during the step operation.
The state of the register file is derived by replaying the register file write operations up to the point of the current instruction. Right now, this code is super inefficient: after every instruction step, I replay the register writes for all registers from the start, time and time again. It’d be very easy to optimize this code.
-
cto continue executing instructions on the CPU until a breakpoint is hit“continue” is the big brother of “step”. In GDBWave, it iterates through the program counter trace until the program counter matches an element in the breakpoint array.
After this, the behavior is just like “step”: the state of the register file is updated, and a TRAP is sent upstream to GDB.
-
Rfor CPU restartThis resets the time step counter back to the first value.
-
Zandzto set and clear breakpointsRSP breakpoints are used for more than just breakpoints that are explicitly set with the GDB breakpoint command. They are also used when you use the
nextcommand: GDB sets a temporary breakpoint at the next line of your program.But even explicit breakpoints are being set and cleared all the time. I’m not really clear why GDB does that, but I assume it has to do with making things work with all kinds of weird embedded system configurations.
GDB makes a distinction between software and hardware breakpoints. Hardware breakpoints are dedicated hardware resources inside the CPU. If any, there are usually only on a few of them, and GDB will only use them if you explicitly ask for it with the “hbreak” command. A software breakpoint is usually achieved by replacing an regular instruction with some kind of trap instruction in the instuction RAM. (In the case of RISC-V, it’s the EBREAK instruction.) Once this trap is triggered, the GDB server is expected to replace the trap instruction with the original instruction, before continuing execution. You can have an unlimited number of software breakpoints. In practice, hardware breakpoints are only used when you’re debugging code that’s located in ROM.
With all that said, when GDB asks the server to set a software breakpoint, all it cares about is that the breakpoint is dealt with by the server. GDBWave maintains an associative array, indexed with the program counter, with all active breakpoints.
-
porgto read one or all CPU registersWhenever the CPU comes to a halt, GDB tries to read the CPU registers. The state of the register file was already updated after doing a step or continue operation, so GDBWave needs to do is return the requested data.
-
mto read a section of memoryReading sections of memory is another very popular GDB request: it is used to fetch the value of variables, the call stack, or the assembler instructions of code that’s being disassembled.
In GDBWave, getting the value of a memory location at the particular time stamp is implemented very similar to the way it’s done for the register file: starting with the initial value that was loaded from the binary file, all memory writes are applied up to the time stamp of the current program counter.
-
kto kill the currently running project and prepar to restart from scratch.At first, I didn’t think this was necessary, but for some reason, GDB issues
kafter issuingrunon the command line, and if you don’t act on it, GDB got very confused. After implementing it, I could issuesrunreliably.When I write “implement” what that really means is: don’t send an error packet back to indicate that it’s not implemented. In fact, don’t reply with anything at all. Because that’s what the GDB RSP manual tells you to do.
And that’s really it! There are number of RSP commands for which GDBWave will reply with an OK packet, but everything else gets ignored.
Running GDBWave on an example VexRiscv design with Icarus Verilog
To try GDBWave yourself, head over to my gdbwave repo on GitHub.
-
Clone the project to your Linux machine
git clone https://github.com/tomverbeure/gdbwave.git -
Build GDBWave
cd ./src && makeThe
gdbwaveexecutable will be in./srcwhen all is done. -
Clone the
vexriscv_ocd_blogrepo that I’ve already used for some other blog posts in this series.git clone https://github.com/tomverbeure/vexriscv_ocd_blog.gitI’ve added GDBWave support to the
./tbdirectory, with uses Icarus Verilog as simulator. -
Install a recent version of Icarus Verilog
My version was compiled from source code. The version that came with Ubuntu was too old and didn’t support FST waveform dumping.
-
Change
./sw/Makefileto point to your RISC-V GNU toolchainIf you don’t have a RISC-V toolchain installed, you can download pre-built binary releases from the SiFive GitHub repo.
-
Build the software image
cd ./sw
make
This builds 3 important images:
program[0..3].hexis for the./rtl/top.vtestbench to initialize the RAMs that’s connected to the CPU. It’s used during simluation.program.binis used by GDBWave to initialize its model of the RAM.program.elfis used by gdb to map RAM addresses back to the C source code.
The Makefile will create some other
progmemfile with different extensions, but we won’t use those here. -
Create an FST waveform file in the
./tbdirectorycd ./tb TRACE_FST=yes makeIf all goes well, you should see this:
vvp ./tb -fst +fst
FST info: dumpfile waves.fst opened for output.
              3950: led0 changed to 0
             22350: led0 changed to 1
             22350: led1 changed to 0
             40650: led1 changed to 1
             40650: led2 changed to 0
             60250: led0 changed to 0
             60250: led2 changed to 1
             78650: led0 changed to 1
             78650: led1 changed to 0
             96950: led1 changed to 1
             96950: led2 changed to 0
You’ll end up with a
waves.fstfile. If you mistakenly ranmakeinstead ofTRACE_FST=yes make, you’ll get a VCD file in the./tbdirectory. In my case, the VCD file was 3458688 bytes. The FST file is 76836 bytes, or 45 times smaller! -
Change the
GDBWAVEvariable in ./tb/Makefile to point to yourgdbwaveexecutable. -
Run GDBWave in the
./tbdirectorymake gdbwaveYou should see this:
  ~/projects/gdbwave/src/gdbwave -w waves.fst -c ./configParams.txt
  INFO   : Reading configuration parameters...
  INFO   : cpuClk:tb.u_top.u_vex.cpu.clk
  INFO   : retiredPc:tb.u_top.u_vex.cpu.lastStagePc [31:0]
  INFO   : retiredPcValid:tb.u_top.u_vex.cpu.lastStageIsValid
  INFO   : regFileWriteValid:tb.u_top.u_vex.cpu.lastStageRegFileWrite_valid
  INFO   : regFileWriteAddr:tb.u_top.u_vex.cpu.lastStageRegFileWrite_payload_address [4:0]
  INFO   : regFileWriteData:tb.u_top.u_vex.cpu.lastStageRegFileWrite_payload_data [31:0]
  INFO   : memCmdValid:tb.u_top.dBus_cmd_valid
  INFO   : memCmdReady:tb.u_top.dBus_cmd_ready
  INFO   : memCmdAddr:tb.u_top.dBus_cmd_payload_address [31:0]
  INFO   : memCmdSize:tb.u_top.dBus_cmd_payload_size [1:0]
  INFO   : memCmdWr:tb.u_top.dBus_cmd_payload_wr
  INFO   : memCmdWrData:tb.u_top.dBus_cmd_payload_data [31:0]
  INFO   : memRspValid:tb.u_top.dBus_rsp_ready
  INFO   : memRspRdData:tb.u_top.dBus_rsp_data [31:0]
  INFO   : memInitFile:../sw/progmem.bin
  INFO   : memInitStartAddr:0
  INFO   : ============================================================
  aliasCount: 114
  curFlatScope:
  curScopeLen: 0
  date: Sun Feb 20 19:26:54 2022
  doubleEndianMatchState: 1
  dumpActivityChangeTime: 0
  dumpActivityChangeValue: 0
  fileType: 0 (VERILOG)
  fseekFailed: 0
  memoryUsedByWriter:134217728
  numDumpActivityChanges: 0
  scopeCount: 9
  startTime: 0
  endTime: 999500
  timeZero: 0
  timescale:-10
  valueChangeSectionCount: 1
  varCount: 1292
  Version string: Icarus Verilog
  ============================================================

  INFO   : Nr CPU instructions: 456
  INFO   : Nr regfile write transactions: 314
  INFO   : Loading mem init file: ../sw/progmem.bin
  INFO   : Nr mem write transactions: 160
  INFO   : Waiting for connection on port 3333...
GDBWave reads a
./configParams.txtfile that defines the signals in the FST file that are needed to extract the program counter trace, and to extract all write operations to the register file and memory.In this particular simulation, it extracted a trace of 456 instructions, 314 register file writes, and 160 memory writes.
Once everything is configured, GDBWave waits for GDB to connected to TCP/IP port 3333.
-
In a different terminal window, use GDB to connect to the GDBWave server
cd ./sw
make gdb_only
This will launch GDB and connect to the server:
/opt/riscv64-unknown-elf-toolchain-10.2.0-2020.12.8-x86_64-linux-ubuntu14/bin/riscv64-unknown-elf-gdb -q \ progmem.elf \ -ex "target extended-remote localhost:3333" Reading symbols from progmem.elf... Remote debugging using localhost:3333 0x00000000 in _start () -
Issue GDB commands as if you were running a real program!
Here I set a breakpoint on
main(), continue the program until the breakpoint, print a variable etc.(gdb) br main Breakpoint 1 at 0xd6: file main.c, line 26. (gdb) c Continuing. Breakpoint 1, main () at main.c:26 26 global_cntr = 0; (gdb) p global_cntr $1 = 0 (gdb) -
If the spartan command line interface of GDB is not what you want, install
gdbguiand debug your program from your browsermake gdbgui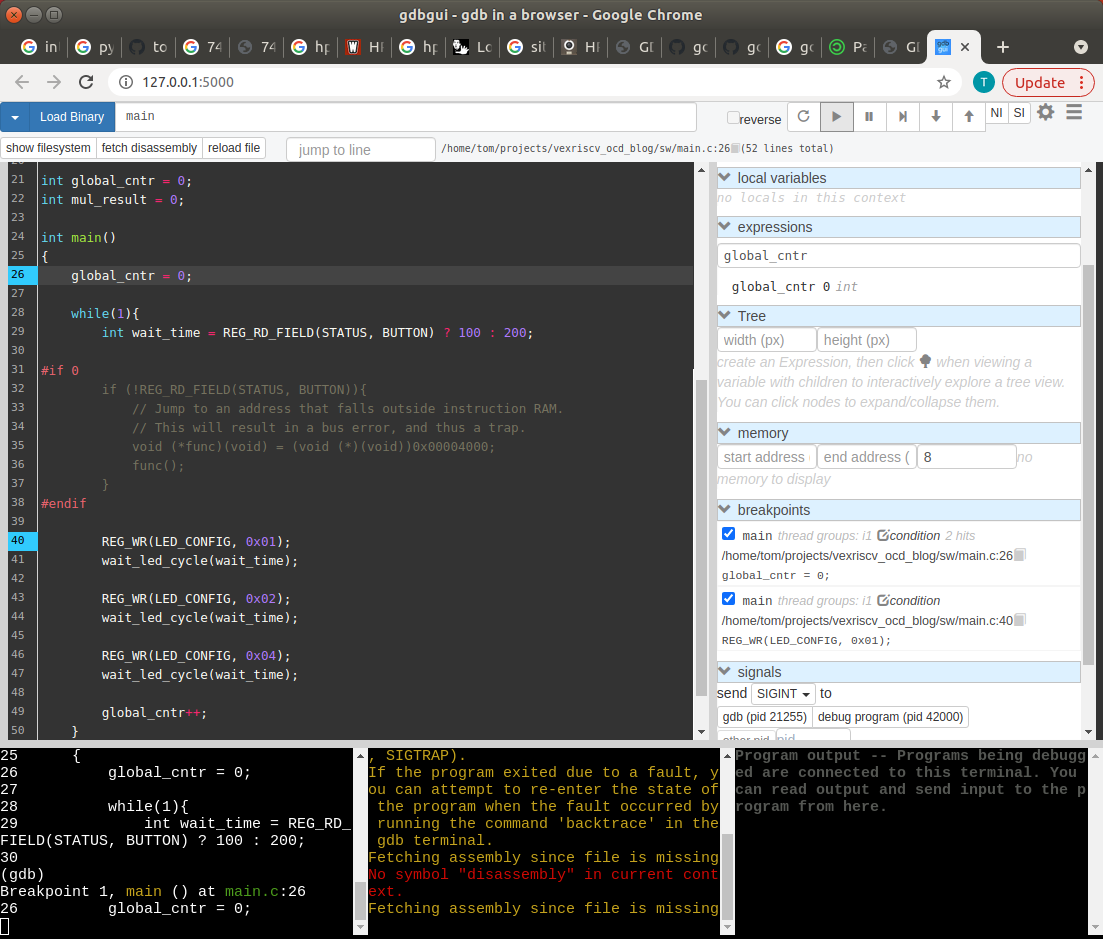
-
Link the current location of the program to a timestamp in the waveform
As you step through the simulated program, GDBWave will print out the timestamp like this:
INFO : PC: 0x000000d6 @ 20000 (3/455)This tells you that the program counter is 0x000000d6, that the timestamp is 20000, and that the proram is currently at the 3rd instruction out of a trace of 456 instructions. You can fill in that 20000 into GTKWave and everything should match.
A Major Unresolved Issue
GDBWave currently has one major issue: GDB will often step into a function even when you’re using ‘n’ or ‘next’. It shouldn’t do that, but I’ve spent many hours pouring through RSP exchanges between GDBWave and GDB and I can’t figure out what’s going wrong.
I currently work around it by setting a temporary breakpoint with tbreak on the next line, but
it’s a clumsy hack that gets annoying real quick. I don’t understand how GDB decides under the
hood when to issue multiple step operations vs a breakpoint/continue combination, and Googling for it
doesn’t give any clue.
GDBWave is useful as it is, but it’d be a whole lot better if this were fixed.
Potential Improvements
GDBWave is already useful for my needs, but it’s a proof of concept. Even if the ‘next’ issue gets fixed eventually, there are are still a lot of potential improvements:
-
Support for other RISC-V instruction tracing formats
Right now, it only supports instruction extraction from FST waveform files. There should be ways to feed other kinds of instruction traces. For example, the picorv32 has an instruction trace port. Or you could use signals from the semi-standard RISC-V Formal Interface (RFVI).
-
Link from GTKWave to GDBWave
It’d be great if you could move the cursor in GTKWave to a certain location and immediately move the program counter in GDBWave to the same position.
This can be accomplished by using a GTKWave translate filter.
-
Link from GDBWave to GTKWave
The opposite of the previous improvement: when you walk through your program, automatically move the cursor in GTKWave.
This is a much harder problem, because GTKWave currently has not facilities to accept external instructions.
-
Support superscalar CPUs
This is necessary to support RISC-V CPUs such as the Swerv or the upcoming NaxRiscv.
-
Support complex memory maps
As it is, GDBWave only supports 1 region in memory to store executable code. There should be a way define complex memory maps with RAMs, ROMs, registers etc.
-
Load ELF files directly
GDBWave requires converting an ELF file to a binary file. There could be all kinds of benefits in supporting ELF files directly.
-
Decode register file and memory reads
By decoding register file and memory reads, it’d be possible check for inconsistencies between the RAM data that’s initialized by the program binary. It would also make in unnecessary to load a program binary under certain conditions.
-
Make GDB talk to GDBWave over a STDIN/STDOUT streams instead of TCP/IP sockets.
Valgrind is good example of a tool that supports this. It has the benefit that you can start GDBWave from within GDB like this:
target remote | .../gdbwave.
In short: a lot can be done to bring GDBWave to the next level.
GDBWave’s Future?
Working on GDBWave was certainly interesting, but I once again realized that I like working on hardware more, so I don’t expect to be spending a lot more time on it. But if it’s useful enough, maybe somebody would be willing to take ownership and take it to the next level?
References
GDBWave
Waveform Formats
GDB
- GDB Remote Serial Protocol
- Howto: GDB Remote Serial Protocol - Writing a RSP Server
- GDB - Signals
- How to work with signals in GDB
Open source GDB stubs
-
A simple, dependency-free GDB stub that can be easily dropped in to your project.
GDBWave is based on this one.
-
A gdbstub for connecting GDB to a RISC-V Debug Module.
-
An ergonomic and easy-to-integrate implementation of the GDB Remote Serial Protocol in Rust, with full no_std support.
-
GDB stub that allows debugging of embedded devices.
Open source GDB servers
-
GDB server implemented as a library in C++. To be hooked up to simulation/emulation targets.
-
A tiny debugger implement the GDB Remote Serial Protocol. Can work on i386, x86_64, ARM and PowerPC.
-
GDB Server for interacting with RISC-V models, boards and FPGAs
Way too elaborate for what I needed.
Footnotes
-
A GDB stub doesn’t have to communicate with GDB over a TCP/IP socket. A good counter example is the GDB version that you use to debug programs that run natively on your PC. But GDB also natively supports serial ports to communicate with a GDB stub, or even communication through STDIN/STDOUT streams. Check out the Connecting to a Remote Target section of the GDB manual for more. ↩
-
If you’re wondering why I used a GDB stub instead of a GDB server as basis for GDBWave, it’s because I only figured out the difference between a stub and a server well after I started writing this blog post, when almost all coding on GDBWave was complete. If I could redo everything from scratch, I’d probably use UoS-EEC/gdb-server. ↩
-
It’s usually trivial to find the program counter of instructions that the CPU wants to execute: just look at the addresses on the bus that the CPU uses to read from instruction memory or cache. But those addresses are not necessary instructions that the CPU will execute to completion, because CPUs often fetch instructions that are later discarded after a mispredicted branch. ↩
-
This code is a great example to illustrate how much C++ has changed in the last 2 decades. I copied the code from StackOverflow. While I can guess what’s going on there, I definitely can’t claim to understand it fully. ↩